Liberal Arts General Studies at The University of Montana
If you are interested in studying Liberal Arts General Studies, take a look at what The University of Montana. We’ve gathered the following information to help you decide.
The University of Montana is in Missoula, MT.
For the most recent IPEDS reporting year, 149 liberal arts general studies graduations were recorded at The University of Montana.
Featured schools near , edit
Studying Online at The University of Montana
Online coursework is an option at The University of Montana. Of 10,811 students, 2,398 (22%) studied exclusively online and 3,174 (29%) took at least some classes online.
Liberal Arts General Studies Rankings at The University of Montana
These rankings give you a sense of how The University of Montana’s Liberal Arts General Studies program against peer institutions.
Bachelor’s-Level Rankings
| Ranking | Scope | Rank |
|---|---|---|
| Best Schools (Quality) | Montana | #7 of 10 |
| Best Value | Montana | #9 of 10 |
| Best Schools (Quality) | Rocky Mountains (Region) | #47 of 62 |
| Best Value | Rocky Mountains (Region) | #52 of 62 |
| Best Schools (Quality) | Nationwide | #1014 of 1,453 |
| Best Value | Nationwide | #1217 of 1,495 |
Associate-Level Rankings
| Ranking | Scope | Rank |
|---|---|---|
| Best Schools (Quality) | Montana | #7 of 10 |
| Best Value | Montana | #9 of 10 |
| Best Schools (Quality) | Rocky Mountains (Region) | #47 of 62 |
| Best Value | Rocky Mountains (Region) | #52 of 62 |
| Best Schools (Quality) | Nationwide | #1014 of 1,453 |
| Best Value | Nationwide | #1217 of 1,495 |
Earnings for Liberal Arts General Studies Graduates from The University of Montana
Those who finish The University of Montana’s Liberal Arts General Studies program earn at the following median levels (per the U.S. Department of Education’s College Scorecard):

| Years After Graduation | Median Earnings |
|---|---|
| 1 year | $19,930 |
| 2 years | $22,912 |
| 3 years | $24,473 |
| 4 years | $28,823 |
| 5 years | $44,925 |
How does this compare to the school overall? Four years out, Liberal Arts General Studies graduates from The University of Montana report median earnings of $28,823, compared with $49,692 for all The University of Montana graduates — about 42% lower than the school-wide median.

Median Debt at Graduation
Typical debt at graduation for Liberal Arts General Studies graduates from The University of Montana is $18,500.
Student Demographics & Diversity
Below you’ll find the composition of Liberal Arts General Studies graduates at The University of Montana, by degree type.
Program-wide, Liberal Arts General Studies graduates at The University of Montana are 62% women (93) and 38% men (56).
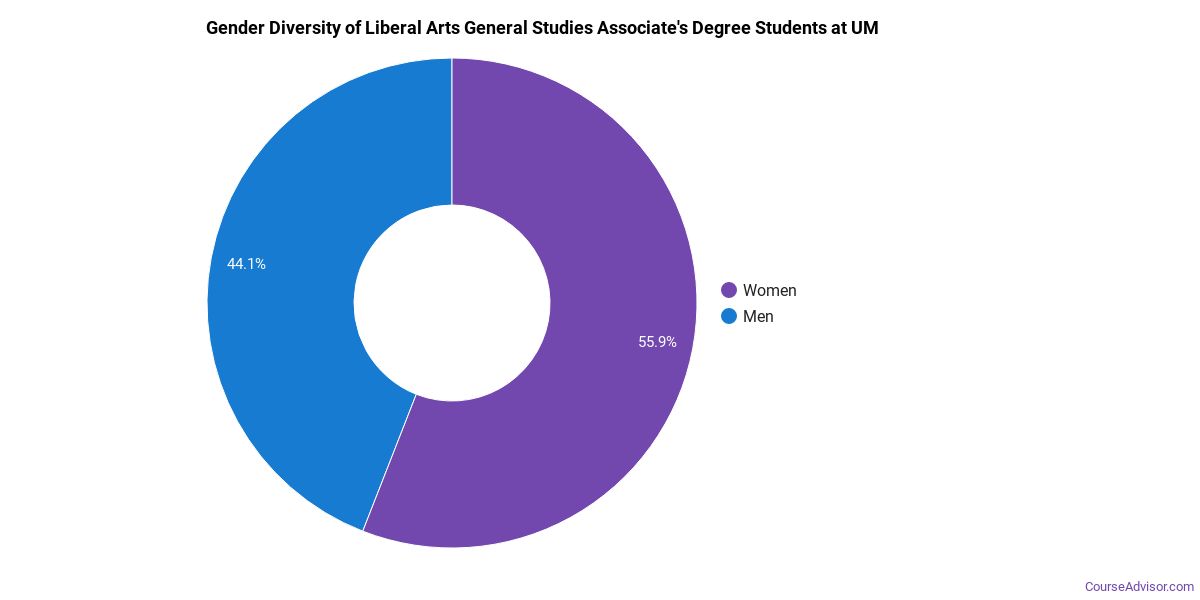
Liberal Arts General Studies Associate’s Program at The University of Montana
Among the 146 associate’s liberal arts general studies graduates at The University of Montana, 62% were women (91) and 38% were men (55).
The following table and chart show the race/ethnicity of Liberal Arts General Studies associate’s degree recipients at The University of Montana.
| Race / Ethnicity | Number of Graduates |
|---|---|
| White | 104 |
| Hispanic / Latino | 12 |
| Black / African American | 6 |
| American Indian / Alaska Native | 4 |
| Two or More Races | 17 |
| International (Nonresident) | 1 |
| Unknown | 2 |
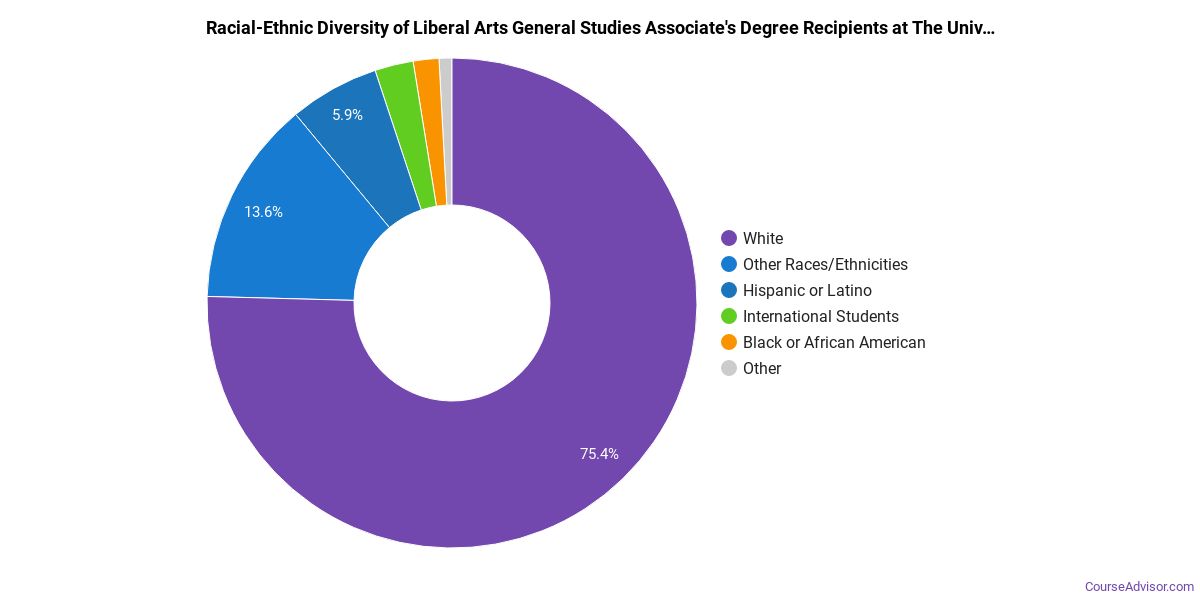
Racial-ethnic minorities make up 27% of Liberal Arts General Studies associate’s degree recipients at The University of Montana, lower than the national average of 49%.*
Liberal Arts General Studies Master’s Program at The University of Montana
Among the 1 master’s liberal arts general studies graduates at The University of Montana, 100% were women (1) and 0% were men (0).

The following table and chart show the race/ethnicity of Liberal Arts General Studies master’s degree recipients at The University of Montana.
| Race / Ethnicity | Number of Graduates |
|---|---|
| American Indian / Alaska Native | 1 |

Racial-ethnic minorities make up 100% of Liberal Arts General Studies master’s degree recipients at The University of Montana, above the national average of 30%.*
Liberal Arts General Studies Doctoral Program at The University of Montana
Of the 1 doctoral liberal arts general studies degrees awarded at The University of Montana, 100% were women (1) and 0% were men (0).

The following table and chart show the race/ethnicity of Liberal Arts General Studies doctoral degree recipients at The University of Montana.
| Race / Ethnicity | Number of Graduates |
|---|---|
| American Indian / Alaska Native | 1 |

Minority students account for 100% of Liberal Arts General Studies doctoral degree recipients at The University of Montana, above the national average of 32%.*
*The racial-ethnic minorities figure is the total number of graduates minus White, international (nonresident), and unknown-race graduates.
More Specific Liberal Arts General Studies Concentrations at The University of Montana
The Liberal Arts General Studies program at The University of Montana includes the following sub-specializations:
| Concentration | Graduates |
|---|---|
| Liberal Arts | 1 |
| General Studies | 108 |
| Individualized Studies | 40 |
Highest-Paying Careers for Liberal Arts General Studies Graduates
Students who finish Liberal Arts General Studies program at The University of Montana work across a variety of fields. The table below ranks the top-paying careers for Liberal Arts General Studies graduates, ordered by median annual salary:
| Occupation | Nationwide Median Wage |
|---|---|
| Postsecondary Teachers, All Other | $68,967 |
References
- IPEDS — Integrated Postsecondary Education Data System
- U.S. Department of Education — College Scorecard
- O*NET Online (Bureau of Labor Statistics)
- National Center for Education Statistics
More about our data sources and methodologies.
Course Advisor provides higher-education, college and university, degree, program, career, salary, and other helpful information to students, faculty, institutions, and other internet audiences. Presented information and data are subject to change. Inclusion on this website does not imply or represent a direct relationship with the company, school, or brand. Information, though believed correct at time of publication, may not be correct, and no warranty is provided. Contact the schools to verify any information before relying on it. Financial aid may be available for those who qualify. The displayed options may include sponsored or recommended results, not necessarily based on your preferences.
© Course Advisor – All Rights Reserved.