The University of Findlay Science & Tech Programs
The University of Findlay is a private not-for-profit institution located in Findlay, OH. A Distant Town offers a peaceful environment near the excitement of urban amenities.
Featured schools near , edit
The University of Findlay Rankings
The University of Findlay appears in the following rankings for science & tech programs at the bachelors level:
| Ranking | Rank | Among |
|---|---|---|
| Overall Quality | #14 of 231 | State — Ohio |
| Overall Quality | #87 of 719 | Region — Great Lakes |
| Overall Quality | #540 of 4,630 | Nationwide |
Where Is The University of Findlay?
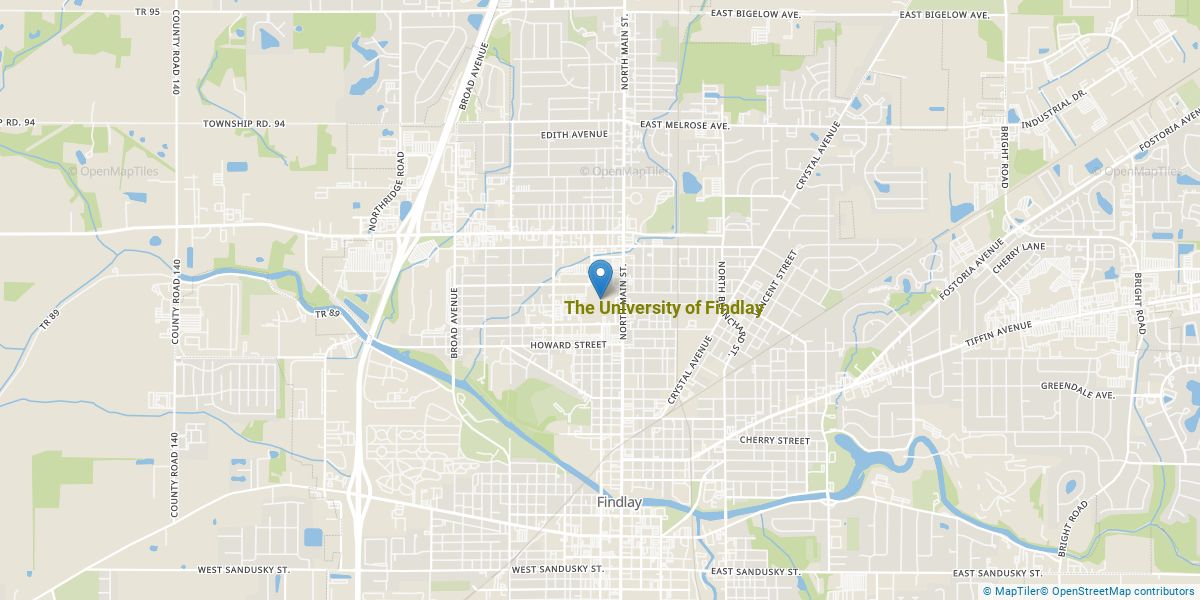
Contact information for The University of Findlay are listed below.
| Contact Details | |
|---|---|
| Address: | 1000 North Main Street, Findlay, OH 45840-3653 |
| Phone: | 8004729502 |
| Website: | findlay.edu/ |
| Admissions: | findlay.edu/admissions/ |
| Financial Aid: | findlay.edu/financial-aid/ |
How Do I Get Into The University of Findlay?
You can apply to The University of Findlay online at: apply.findlay.edu/portal/apply-now
The University of Findlay is classified as Less Selective (70-85%) for admissions.
Admission Requirements for The University of Findlay
Here’s what The University of Findlay looks for in applicants:
| Requirement | Status |
|---|---|
| Secondary School Record | Neither required nor recommended |
| Secondary School GPA | Required |
| Recommendations | Neither required nor recommended |
| Admission Test Scores (SAT/ACT) | Neither required nor recommended |
How Hard Is It To Get Into The University of Findlay?
The University of Findlay has an acceptance rate of 83%, making it highly accessible. Be sure to prepare a complete application and prepare the application in full.
Of those admitted, 17% choose to enroll — a modest enrollment yield, suggesting many admitted students choose other institutions.
Average Test Scores
Selectivity by Gender
Acceptance rates at The University of Findlay are broken out by gender below.
| Gender | Applicants | Admitted | Acceptance Rate |
|---|---|---|---|
| Men | 1,286 | 1,033 | 80% |
| Women | 2,754 | 2,356 | 86% |
Can I Afford The University of Findlay?
The average net price after aid at The University of Findlay is $23,731. Your actual cost will depend on your family’s circumstances since net price varies by income group.
Tuition & Fees
| Category | Cost |
|---|---|
| In-State Tuition | $39,664 |
| In-State Fees | $1,500 |
| Out-of-State Tuition | $39,664 |
| Out-of-State Fees | $1,500 |
| Total In-State Tuition & Fees | $41,164 |
| Total Out-of-State Tuition & Fees | $41,164 |
Financial Aid
Across all aid types, 16% of students at The University of Findlay receive some form of financial aid (613 students).
Approximately 57% of students at The University of Findlay receive grant or scholarship aid, averaging $25,615 per student.
15% of students receive federal Pell Grants, averaging $5,075.
Student Loan Debt
35% of The University of Findlay undergraduates take out federal student loans, averaging $7,349 per year.
The University of Findlay Undergraduate Student Diversity
There are 1,470 students enrolled at The University of Findlay. The University of Findlay is classified as a 5,000 - 9,999 institution by enrollment size. Its Carnegie Classification is Doctoral/Professional Universities.
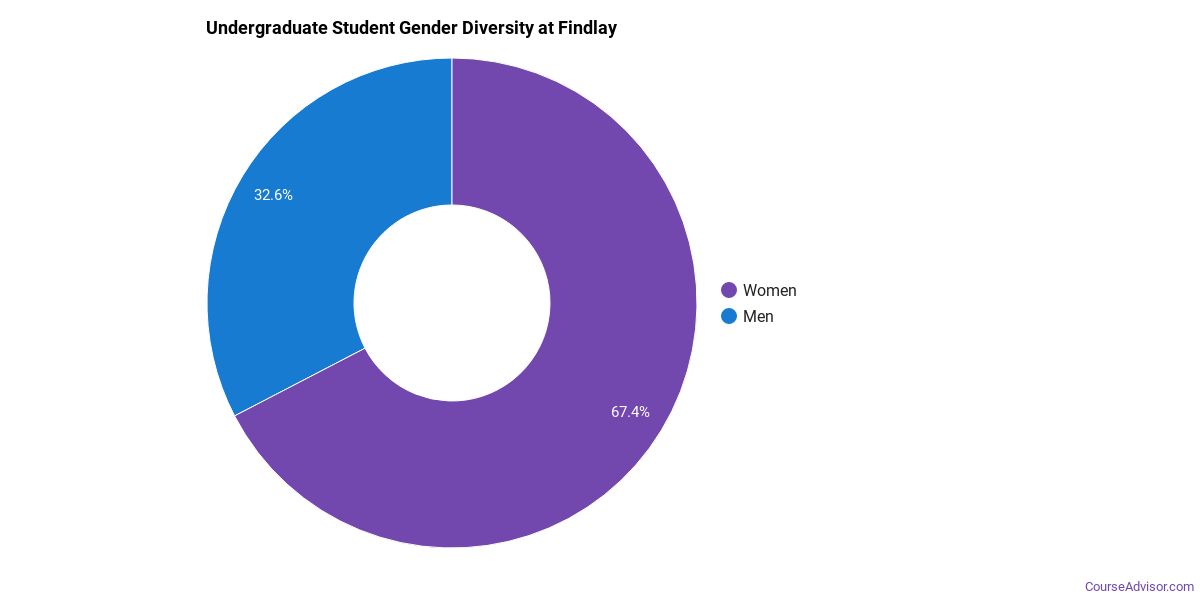
Gender Diversity
Of the 2,240 undergraduate students at The University of Findlay, approximately 36% are male and 64% are female.
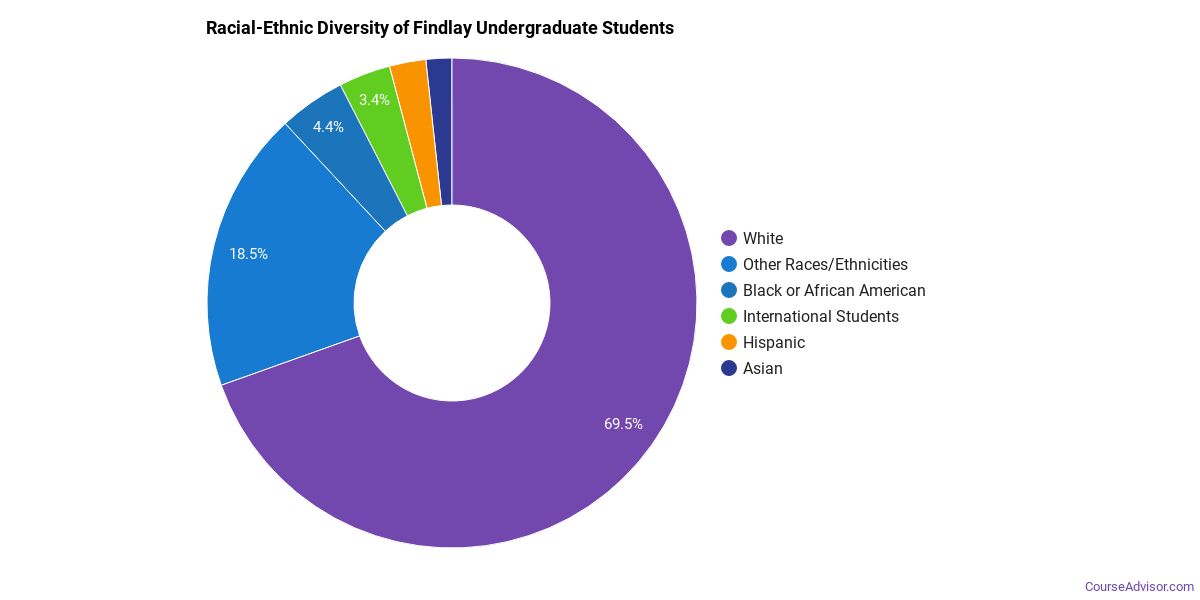
Racial-Ethnic Diversity
The racial-ethnic breakdown of The University of Findlay undergraduate students is as follows.
| Race/Ethnicity | Number of Students |
|---|---|
| Asian | 33 |
| Black or African American | 78 |
| Hispanic | 100 |
| White | 1,700 |
| American Indian/Alaska Native | 2 |
| Native Hawaiian/Pacific Islander | 2 |
| Two or More Races | 67 |
| Non-Resident | 42 |
Geographic Diversity
The top 5 home states of first-time undergraduate students at The University of Findlay are shown below.

| State | First-Time UG Students |
|---|---|
| Ohio | 446 |
| Michigan | 34 |
| Pennsylvania | 23 |
| Indiana | 18 |
| Massachusetts | 9 |
Additionally, approximately 1.9% of undergraduate students are non-resident from outside the United States.
The University of Findlay Graduate Student Diversity
1,103 of The University of Findlay’s students are in graduate programs. The highest graduate-level award offered is Doctor’s degree.
Gender Diversity (Graduate)
Among graduate students at The University of Findlay, approximately 40% are male and 60% are female.

Racial-Ethnic Diversity (Graduate)
The racial-ethnic breakdown of The University of Findlay graduate students is as follows.

| Race/Ethnicity | Number of Students |
|---|---|
| Asian | 24 |
| Black or African American | 41 |
| Hispanic | 29 |
| White | 576 |
| American Indian/Alaska Native | 2 |
| Two or More Races | 17 |
| Non-Resident | 341 |
Online Learning at The University of Findlay
The University of Findlay provides online programs for students who need flexibility.
1,285 undergraduate students at The University of Findlay took at least one online class — of those, 260 took all of their classes online.
At the graduate level, 394 students took at least one online class and 257 took all classes online. Distance education is available at the undergraduate and graduate levels.
Academic Programs at The University of Findlay
The University of Findlay offers 22 distinct academic programs.
The highest level of award offered is Doctor’s degree.
Institutional Profile
The University of Findlay has an open admission policy: No. Credit transfer:
- AP credits: Yes
- Dual enrollment credits: Yes
- Life experience credits: Implied no
References
More about our data sources and methodologies.
Course Advisor provides higher-education, college and university, degree, program, career, salary, and other helpful information to students, faculty, institutions, and other internet audiences. Presented information and data are subject to change. Inclusion on this website does not imply or represent a direct relationship with the company, school, or brand. Information, though believed correct at time of publication, may not be correct, and no warranty is provided. Contact the schools to verify any information before relying on it. Financial aid may be available for those who qualify. The displayed options may include sponsored or recommended results, not necessarily based on your preferences.
© Course Advisor – All Rights Reserved.