Mathematics at Swarthmore College
What traits are you looking for in a school for Mathematics, consider the program at Swarthmore College. The following information will help you decide if it is a good fit for you.
Swarthmore College is in Swarthmore, PA.
In the most recent year for which we have data, 56 mathematics degrees were awarded at Swarthmore College.
Featured schools near , edit
Online Class Availability at Swarthmore College
Swarthmore College primarily offers on-campus instruction; distance-education enrollment is limited.
Mathematics Rankings at Swarthmore College
Rankings can help you compare Swarthmore College’s Mathematics program to other colleges that offer this major.
Bachelor’s-Level Rankings
| Ranking | Scope | Rank |
|---|---|---|
| Best Value | Pennsylvania | #1 of 24 |
| Best Schools (Quality) | Pennsylvania | #7 of 24 |
| Best Schools (Quality) | Middle Atlantic (Region) | #21 of 72 |
| Best Value | Middle Atlantic (Region) | #21 of 71 |
| Best Schools (Quality) | Nationwide | #90 of 462 |
| Best Value | Nationwide | #274 of 460 |
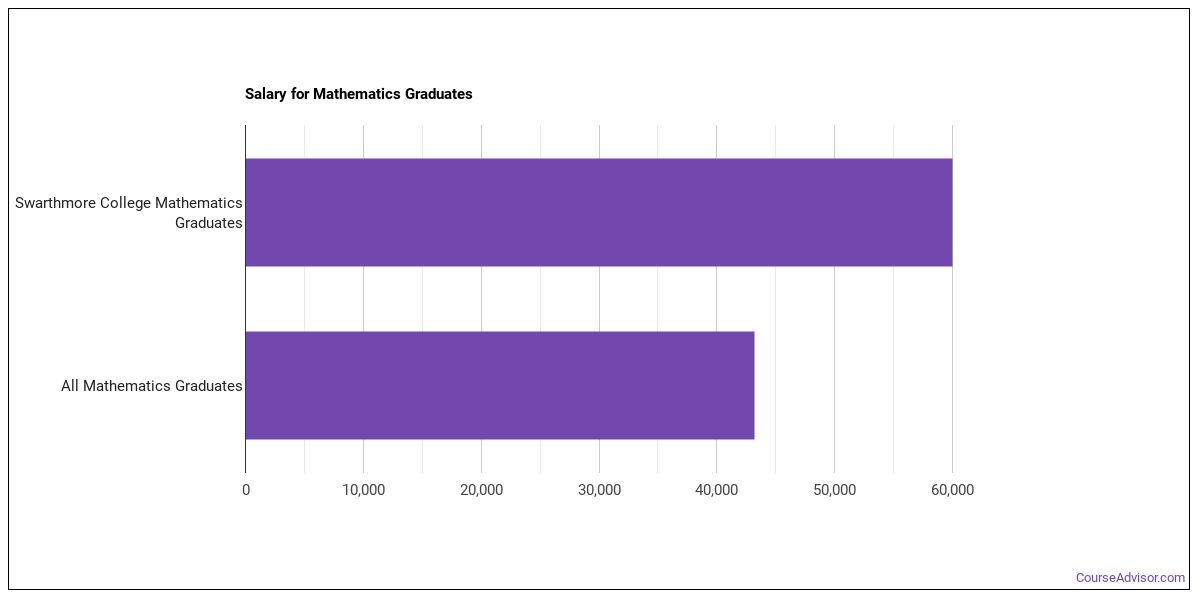
Earnings for Mathematics Graduates from Swarthmore College
Graduates of Swarthmore College’s Mathematics program earn at the following median levels (per the U.S. Department of Education’s College Scorecard):
| Years After Graduation | Median Earnings |
|---|---|
| 1 year | $59,964 |
| 2 years | $125,015 |
| 5 years | $143,223 |
Student Demographics & Diversity
Below you’ll find the student demographics for Mathematics graduates at Swarthmore College, broken down by degree level.
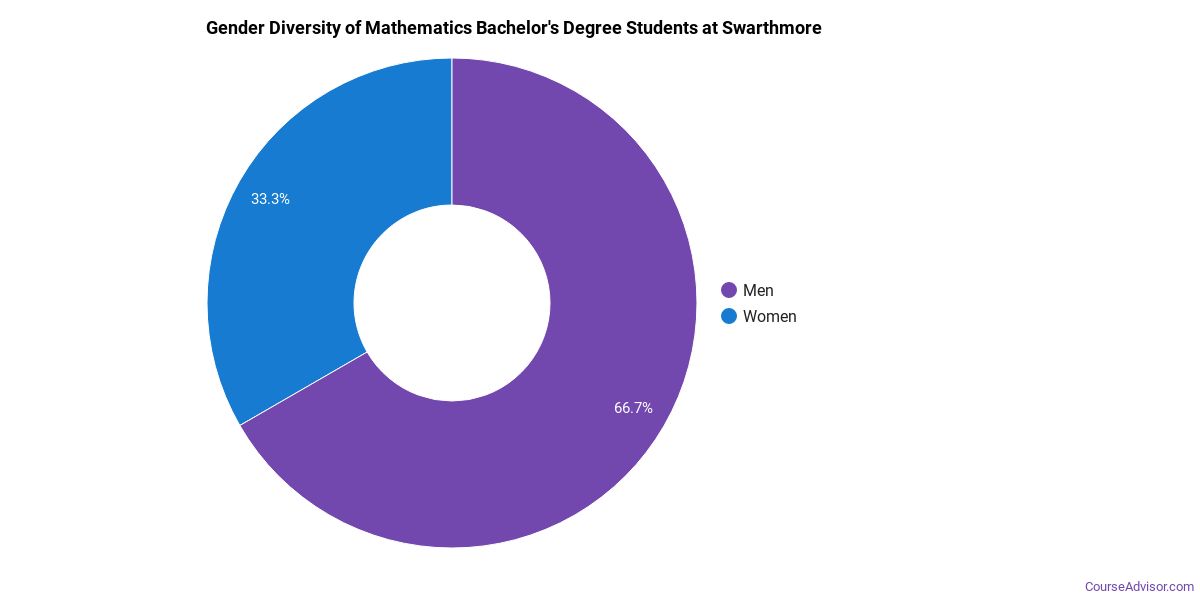
Across all degree levels, Mathematics graduates at Swarthmore College are 41% women (23) and 59% men (33).
Mathematics Bachelor’s Program at Swarthmore College
Of the 56 bachelor’s mathematics degrees awarded at Swarthmore College, 41% were women (23) and 59% were men (33).
The following table and chart show the race/ethnicity of Mathematics bachelor’s degree recipients at Swarthmore College.
| Race / Ethnicity | Number of Graduates |
|---|---|
| White | 13 |
| Hispanic / Latino | 6 |
| Black / African American | 2 |
| Asian | 14 |
| Two or More Races | 4 |
| International (Nonresident) | 16 |
| Unknown | 1 |
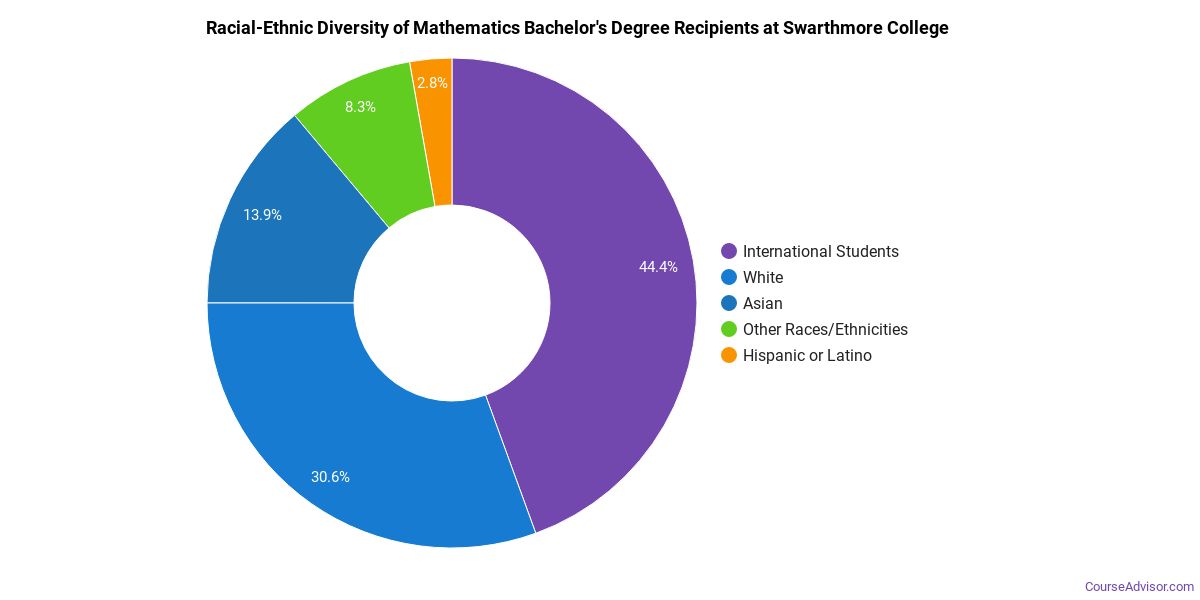
Racial-ethnic minorities make up 46% of Mathematics bachelor’s degree recipients at Swarthmore College, above the national average of 33%.*
*The racial-ethnic minorities figure is the total number of graduates minus White, international (nonresident), and unknown-race graduates.
More Specific Mathematics Concentrations at Swarthmore College
This Mathematics program at Swarthmore College breaks down into more specific concentrations:
| Concentration | Graduates |
|---|---|
| General Mathematics | 56 |
Best-Paid Careers for Mathematics Graduates
Students who finish Mathematics program at Swarthmore College work across a variety of fields. Below are the top-paying careers for Mathematics graduates, ordered by median annual salary:
| Occupation | Nationwide Median Wage |
|---|---|
| Water Resource Specialists | $179,716 |
| Business Intelligence Analysts | $143,840 |
| Natural Sciences Managers | $132,227 |
| Statisticians | $130,349 |
| Bioinformatics Technicians | $121,896 |
| Biostatisticians | $121,594 |
| Clinical Research Coordinators | $110,931 |
| Data Scientists | $106,295 |
| Clinical Data Managers | $99,475 |
| Secondary School Teachers, Except Special and Career/Technical Education | $77,927 |
References
- IPEDS — Integrated Postsecondary Education Data System
- U.S. Department of Education — College Scorecard
- O*NET Online (Bureau of Labor Statistics)
- National Center for Education Statistics
More about our data sources and methodologies.
Course Advisor provides higher-education, college and university, degree, program, career, salary, and other helpful information to students, faculty, institutions, and other internet audiences. Presented information and data are subject to change. Inclusion on this website does not imply or represent a direct relationship with the company, school, or brand. Information, though believed correct at time of publication, may not be correct, and no warranty is provided. Contact the schools to verify any information before relying on it. Financial aid may be available for those who qualify. The displayed options may include sponsored or recommended results, not necessarily based on your preferences.
© Course Advisor – All Rights Reserved.