Public Policy at Empire State University
If you are interested in studying Public Policy, you may want to check out the program at Empire State University. The following information will help you decide if it is a good fit for you.
Empire State University is in Saratoga Springs, NY.
During the most recent reporting year, 62 public policy degrees were granted at Empire State University.
Featured schools near , edit
Online Class Availability at Empire State University
Online coursework is an option at Empire State University. Among 10,469 students, 9,588 (92%) studied exclusively online and 154 (1%) took at least some classes online.
Public Policy Rankings at Empire State University
Rankings can help you compare Empire State University’s Public Policy program to other colleges that offer this major.
Bachelor’s-Level Rankings
| Ranking | Scope | Rank |
|---|---|---|
| Best Value | New York | #1 of 7 |
| Best Value | Middle Atlantic (Region) | #4 of 25 |
| Best Schools (Quality) | New York | #6 of 7 |
| Best Value | Nationwide | #12 of 95 |
| Best Schools (Quality) | Middle Atlantic (Region) | #24 of 25 |
| Best Schools (Quality) | Nationwide | #78 of 96 |
Median Debt at Graduation
Typical debt at graduation for Public Policy graduates from Empire State University comes in at $25,239.
Student Demographics & Diversity
Take a look at the student demographics for Public Policy graduates at Empire State University, broken down by degree level.
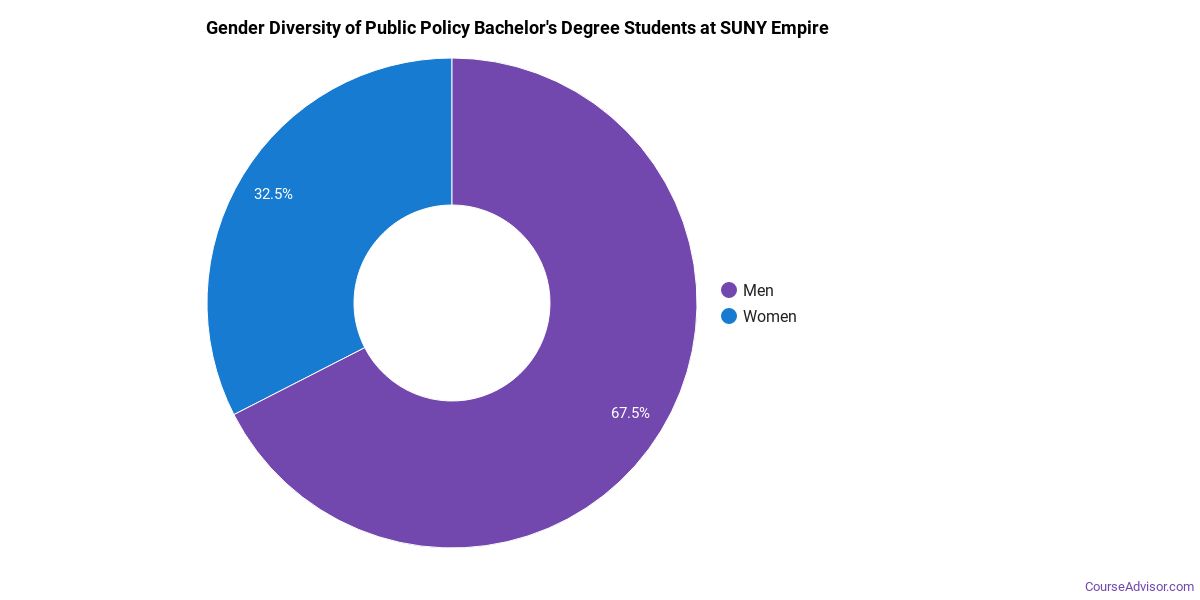
Program-wide, Public Policy graduates at Empire State University are 31% women (19) and 69% men (43).
Public Policy Bachelor’s Program at Empire State University
Among the 61 bachelor’s public policy graduates at Empire State University, 31% were women (19) and 69% were men (42).
The following table and chart show the race/ethnicity of Public Policy bachelor’s degree recipients at Empire State University.
| Race / Ethnicity | Number of Graduates |
|---|---|
| White | 30 |
| Hispanic / Latino | 9 |
| Black / African American | 4 |
| Asian | 1 |
| American Indian / Alaska Native | 1 |
| Two or More Races | 2 |
| International (Nonresident) | 1 |
| Unknown | 13 |
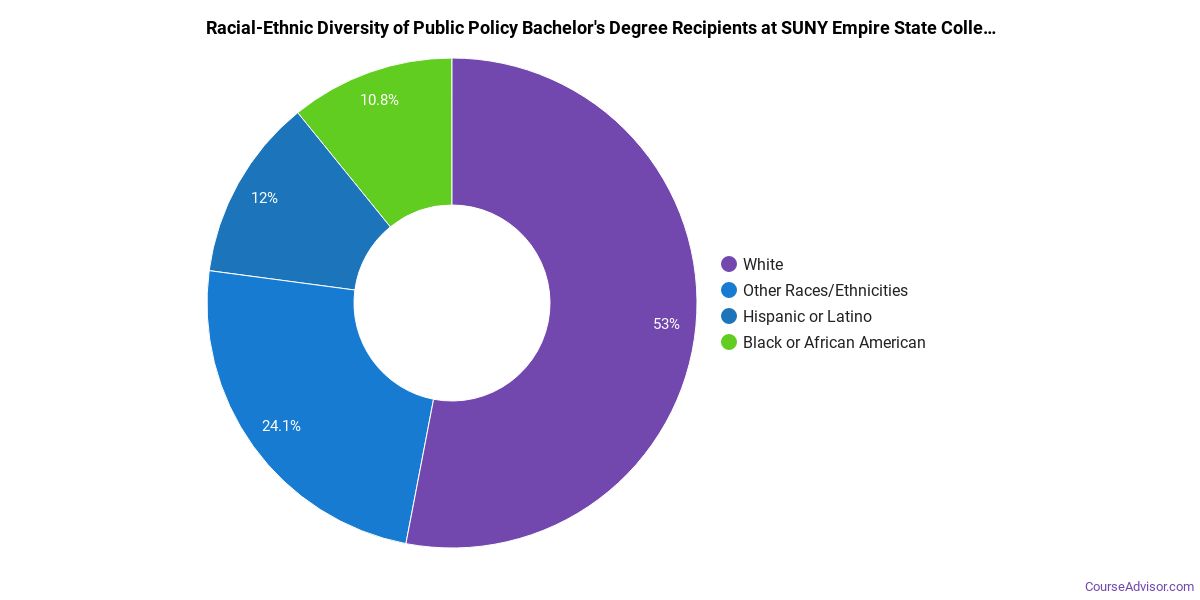
Minority students account for 28% of Public Policy bachelor’s degree recipients at Empire State University, lower than the national average of 45%.*
*The racial-ethnic minorities figure is the total number of graduates minus White, international (nonresident), and unknown-race graduates.
More Specific Public Policy Concentrations at Empire State University
This Public Policy program at Empire State University includes the following sub-specializations:
| Concentration | Graduates |
|---|---|
| General Public Policy Analysis | 61 |
| Other Public Policy Analysis | 1 |
Best-Paid Careers for Public Policy Graduates
Graduates of the Public Policy program at Empire State University work across a variety of fields. The table below ranks the highest-paying careers for Public Policy graduates, ordered by median annual salary:
| Occupation | Nationwide Median Wage |
|---|---|
| Legislators | $167,600 |
| Medical and Health Services Managers | $129,557 |
| Education Teachers, Postsecondary | $98,329 |
| Political Scientists | $71,521 |
| Political Science Teachers, Postsecondary | $66,472 |
| Transportation Planners | $50,855 |
| Health Specialties Teachers, Postsecondary | $46,663 |
| Social Scientists and Related Workers, All Other | $42,168 |
| Social Science Research Assistants | $41,630 |
References
- IPEDS — Integrated Postsecondary Education Data System
- U.S. Department of Education — College Scorecard
- O*NET Online (Bureau of Labor Statistics)
- National Center for Education Statistics
More about our data sources and methodologies.
Course Advisor provides higher-education, college and university, degree, program, career, salary, and other helpful information to students, faculty, institutions, and other internet audiences. Presented information and data are subject to change. Inclusion on this website does not imply or represent a direct relationship with the company, school, or brand. Information, though believed correct at time of publication, may not be correct, and no warranty is provided. Contact the schools to verify any information before relying on it. Financial aid may be available for those who qualify. The displayed options may include sponsored or recommended results, not necessarily based on your preferences.
© Course Advisor – All Rights Reserved.