Public Policy at Stanford University
If you are interested in studying Public Policy, take a look at what Stanford University. Get started with the following essential facts.
Stanford University is located in Stanford, CA.
For the most recent IPEDS reporting year, 46 public policy degrees were granted at Stanford University.
Featured schools near , edit
Studying Online at Stanford University
Many students take online classes at Stanford University. Among 18,625 students, 350 (2%) were enrolled entirely in distance education and 854 (5%) took at least some classes online.
Student Demographics & Diversity
Take a look at the composition of Public Policy graduates at Stanford University, broken down by degree level.
Looking at the program as a whole, Public Policy graduates at Stanford University are 46% women (21) and 54% men (25).
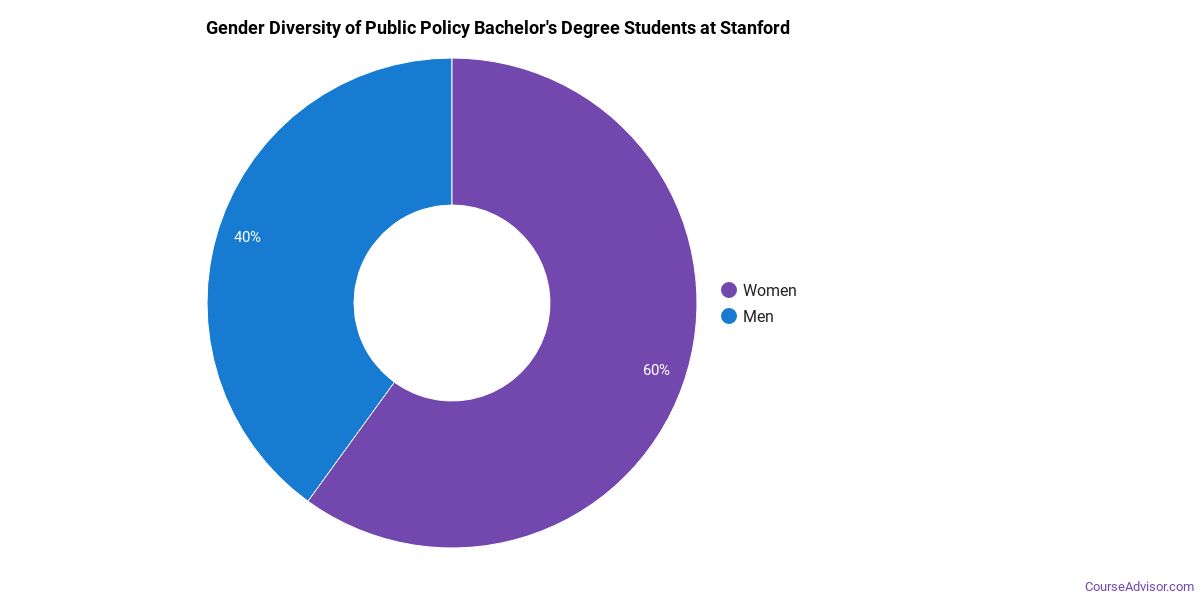
Public Policy Bachelor’s Program at Stanford University
Of the 15 bachelor’s public policy degrees awarded at Stanford University, 47% were women (7) and 53% were men (8).
The following table and chart show the race/ethnicity of Public Policy bachelor’s degree recipients at Stanford University.
| Race / Ethnicity | Number of Graduates |
|---|---|
| White | 5 |
| Hispanic / Latino | 1 |
| Black / African American | 3 |
| Asian | 5 |
| Two or More Races | 1 |
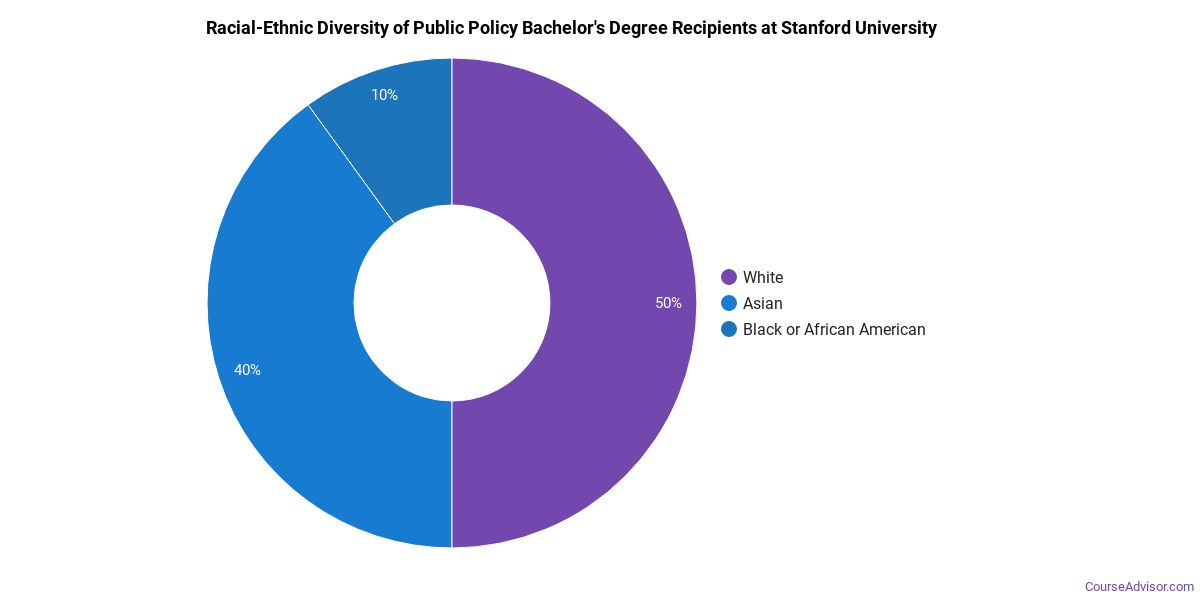
Racial-ethnic minorities make up 67% of Public Policy bachelor’s degree recipients at Stanford University, above the national average of 45%.*
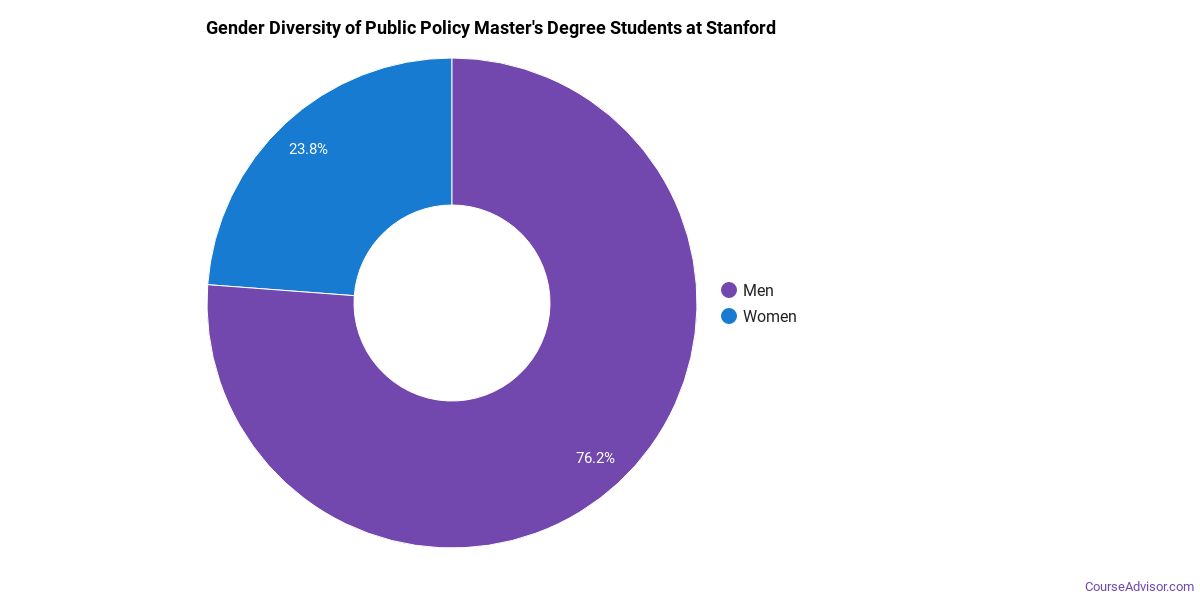
Public Policy Master’s Program at Stanford University
Among the 31 master’s public policy degrees awarded at Stanford University, 45% were women (14) and 55% were men (17).
The following table and chart show the race/ethnicity of Public Policy master’s degree recipients at Stanford University.
| Race / Ethnicity | Number of Graduates |
|---|---|
| White | 12 |
| Hispanic / Latino | 7 |
| Asian | 5 |
| Two or More Races | 1 |
| International (Nonresident) | 6 |
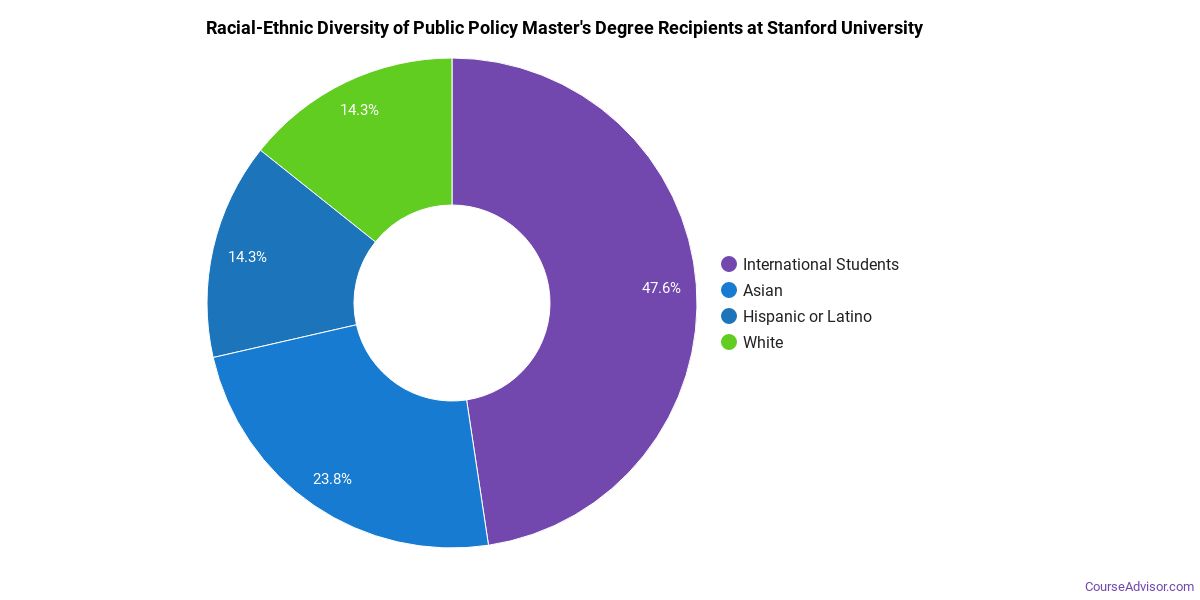
Racial-ethnic minorities make up 42% of Public Policy master’s degree recipients at Stanford University, higher than the national average of 33%.*
*The racial-ethnic minorities figure is the total number of graduates minus White, international (nonresident), and unknown-race graduates.
More Specific Public Policy Concentrations at Stanford University
This Public Policy program at Stanford University includes the following sub-specializations:
| Concentration | Graduates |
|---|---|
| General Public Policy Analysis | 46 |
Top-Paying Careers for Public Policy Graduates
Students who finish Public Policy program at Stanford University work across a variety of fields. The table below ranks the highest-paying careers for Public Policy graduates, ordered by median annual salary:
| Occupation | Nationwide Median Wage |
|---|---|
| Legislators | $167,600 |
| Medical and Health Services Managers | $129,557 |
| Education Teachers, Postsecondary | $98,329 |
| Political Scientists | $71,521 |
| Political Science Teachers, Postsecondary | $66,472 |
| Transportation Planners | $50,855 |
| Health Specialties Teachers, Postsecondary | $46,663 |
| Social Scientists and Related Workers, All Other | $42,168 |
| Social Science Research Assistants | $41,630 |
References
- IPEDS — Integrated Postsecondary Education Data System
- U.S. Department of Education — College Scorecard
- O*NET Online (Bureau of Labor Statistics)
- National Center for Education Statistics
More about our data sources and methodologies.
Course Advisor provides higher-education, college and university, degree, program, career, salary, and other helpful information to students, faculty, institutions, and other internet audiences. Presented information and data are subject to change. Inclusion on this website does not imply or represent a direct relationship with the company, school, or brand. Information, though believed correct at time of publication, may not be correct, and no warranty is provided. Contact the schools to verify any information before relying on it. Financial aid may be available for those who qualify. The displayed options may include sponsored or recommended results, not necessarily based on your preferences.
© Course Advisor – All Rights Reserved.