Classical Languages & Literature at Stanford University
If you are interested in studying Classical Languages & Literature, consider the program at Stanford University. The following information will help you decide if it is a good fit for you.
Stanford University is located in Stanford, CA.
In the most recent year for which we have data, 15 classical languages & literature graduations were recorded at Stanford University.
Featured schools near , edit
Online & Distance Learning at Stanford University
Online coursework is an option at Stanford University. Of 18,625 students, 350 (2%) studied exclusively online and 854 (5%) took at least some classes online.
Student Demographics & Diversity
Below you’ll find the diversity of Classical Languages & Literature graduates at Stanford University, broken down by degree level.
Program-wide, Classical Languages & Literature graduates at Stanford University are 47% women (7) and 53% men (8).
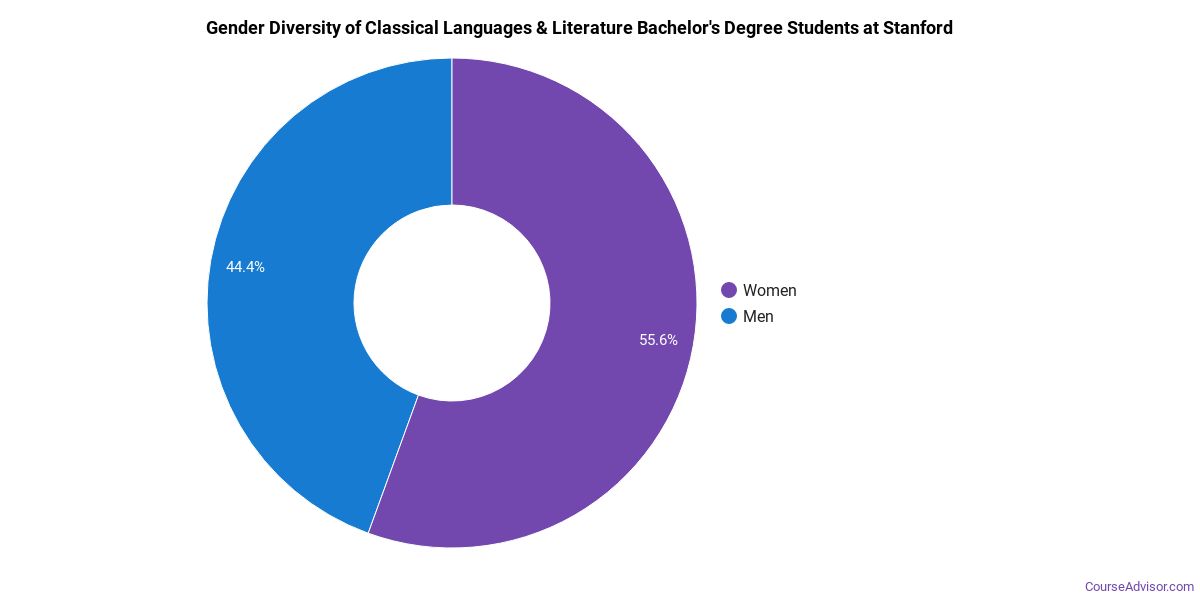
Classical Languages & Literature Bachelor’s Program at Stanford University
Of the 10 bachelor’s classical languages & literature degrees awarded at Stanford University, 50% were women (5) and 50% were men (5).
The following table and chart show the race/ethnicity of Classical Languages & Literature bachelor’s degree recipients at Stanford University.
| Race / Ethnicity | Number of Graduates |
|---|---|
| White | 4 |
| Hispanic / Latino | 1 |
| Black / African American | 1 |
| Asian | 2 |
| Two or More Races | 1 |
| International (Nonresident) | 1 |
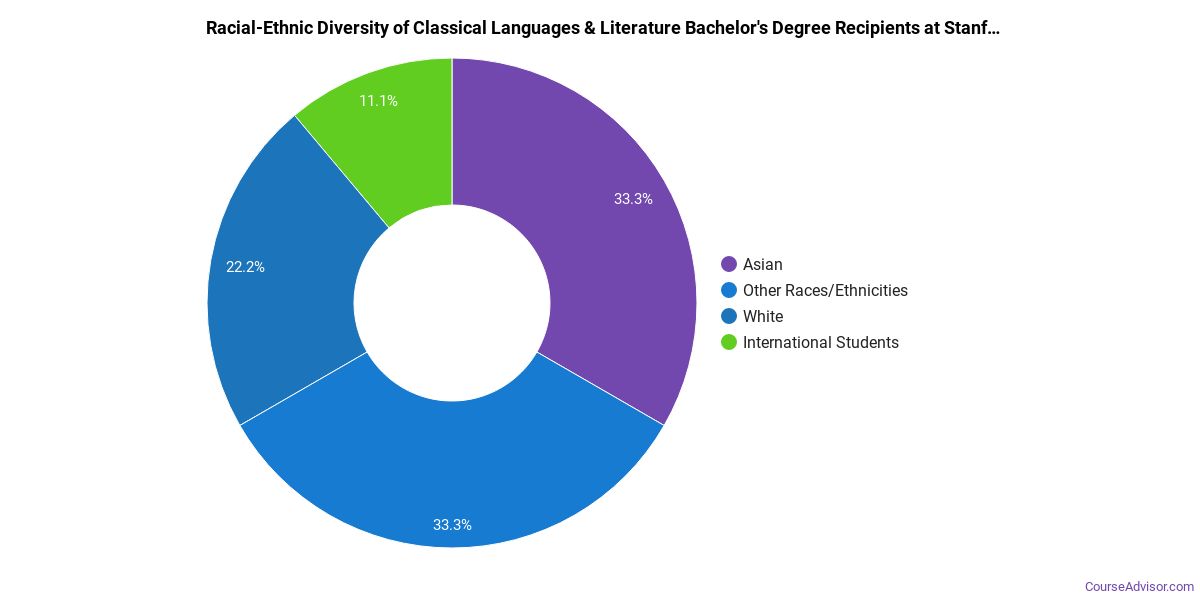
Minority students account for 50% of Classical Languages & Literature bachelor’s degree recipients at Stanford University, higher than the national average of 21%.*
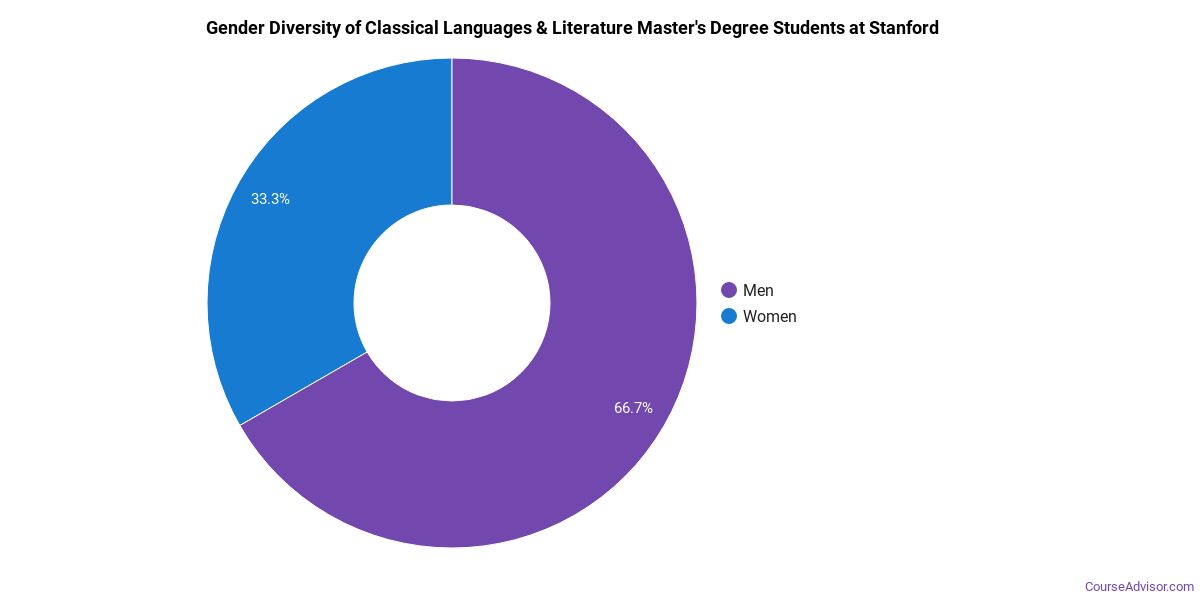
Classical Languages & Literature Master’s Program at Stanford University
Among the 2 master’s classical languages & literature degrees awarded at Stanford University, 50% were women (1) and 50% were men (1).
The following table and chart show the race/ethnicity of Classical Languages & Literature master’s degree recipients at Stanford University.
| Race / Ethnicity | Number of Graduates |
|---|---|
| Asian | 1 |
| Two or More Races | 1 |
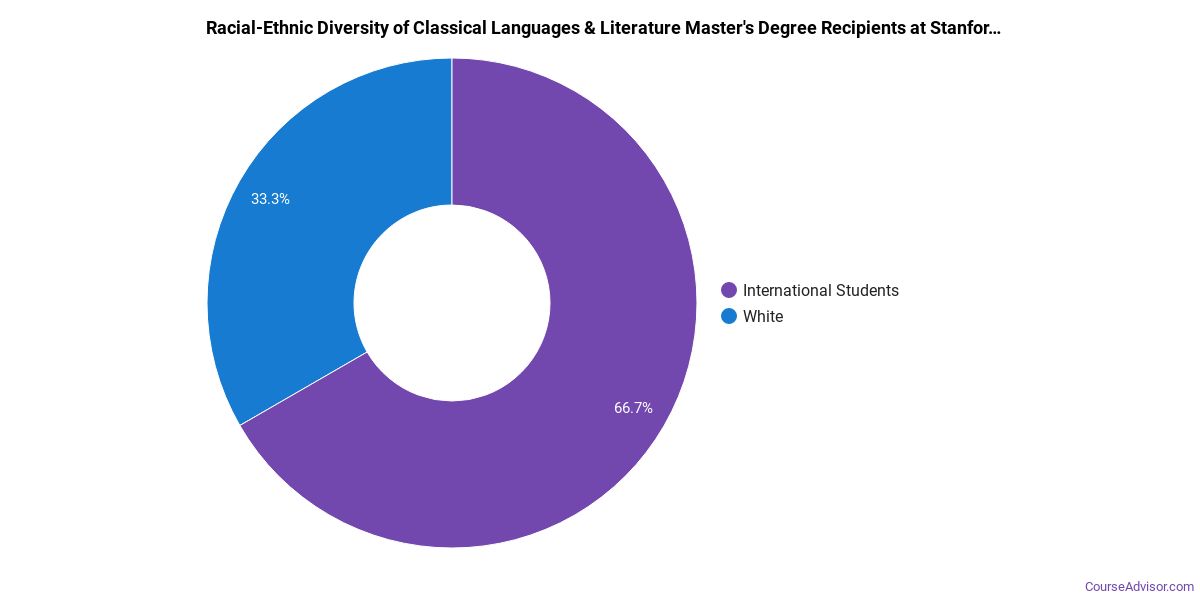
Minority students account for 100% of Classical Languages & Literature master’s degree recipients at Stanford University, higher than the national average of 15%.*
Classical Languages & Literature Doctoral Program at Stanford University
Of the 3 doctoral classical languages & literature graduates at Stanford University, 33% were women (1) and 67% were men (2).

The following table and chart show the race/ethnicity of Classical Languages & Literature doctoral degree recipients at Stanford University.
| Race / Ethnicity | Number of Graduates |
|---|---|
| White | 2 |
| International (Nonresident) | 1 |

*The racial-ethnic minorities figure is the total number of graduates minus White, international (nonresident), and unknown-race graduates.
More Specific Classical Languages & Literature Concentrations at Stanford University
This Classical Languages & Literature program at Stanford University breaks down into more specific concentrations:
| Concentration | Graduates |
|---|---|
| General Classical Languages | 15 |
Highest-Paying Careers for Classical Languages & Literature Graduates
Students who finish Classical Languages & Literature program at Stanford University go on to a range of careers. Below are the top-paying careers for Classical Languages & Literature graduates, ordered by median annual salary:
| Occupation | Nationwide Median Wage |
|---|---|
| Secondary School Teachers, Except Special and Career/Technical Education | $77,927 |
| Interpreters and Translators | $52,627 |
| Foreign Language and Literature Teachers, Postsecondary | $39,815 |
References
- IPEDS — Integrated Postsecondary Education Data System
- U.S. Department of Education — College Scorecard
- O*NET Online (Bureau of Labor Statistics)
- National Center for Education Statistics
More about our data sources and methodologies.
Course Advisor provides higher-education, college and university, degree, program, career, salary, and other helpful information to students, faculty, institutions, and other internet audiences. Presented information and data are subject to change. Inclusion on this website does not imply or represent a direct relationship with the company, school, or brand. Information, though believed correct at time of publication, may not be correct, and no warranty is provided. Contact the schools to verify any information before relying on it. Financial aid may be available for those who qualify. The displayed options may include sponsored or recommended results, not necessarily based on your preferences.
© Course Advisor – All Rights Reserved.