Spoon River College Overview
Spoon River College is a public institution situated in Canton, Illinois. The rural area surrounding SRC is great for students who love a peaceful atmosphere.
What Is Spoon River College Known For?
- The associate's degree is the highest award offered at SRC.
- In a recent academic period42% of the faculty were full-time.
Where Is Spoon River College?
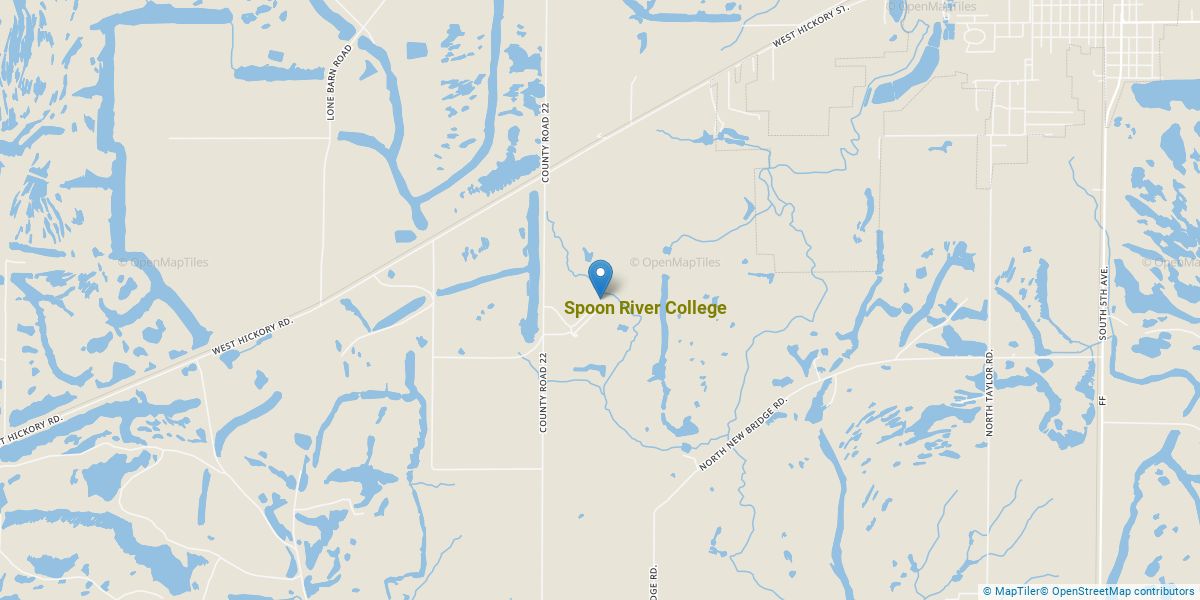
Contact details for SRC are given below.
| Contact Details | |
|---|---|
| Address: | 23235 North County 22, Canton, IL 61520-8622 |
| Phone: | 309-647-4645 |
| Website: | www.src.edu |
How Do I Get Into SRC?
You can apply to SRC online at: https://portal.src.edu/ICS/Admissions/Admissions_Homepage.jnz?portlet=Apply_Online_2.0&screen=Display+Intro&screenType=next
Can I Afford Spoon River College?
Student Loan Debt
While almost two-thirds of students nationwide take out loans to pay for college, the percentage may be quite different for the school you plan on attending. At SRC, approximately 18% of students took out student loans averaging $4,698 a year. That adds up to $18,792 over four years for those students.
Explore Best Ranked Schools for You
Spoon River College Undergraduate Student Diversity
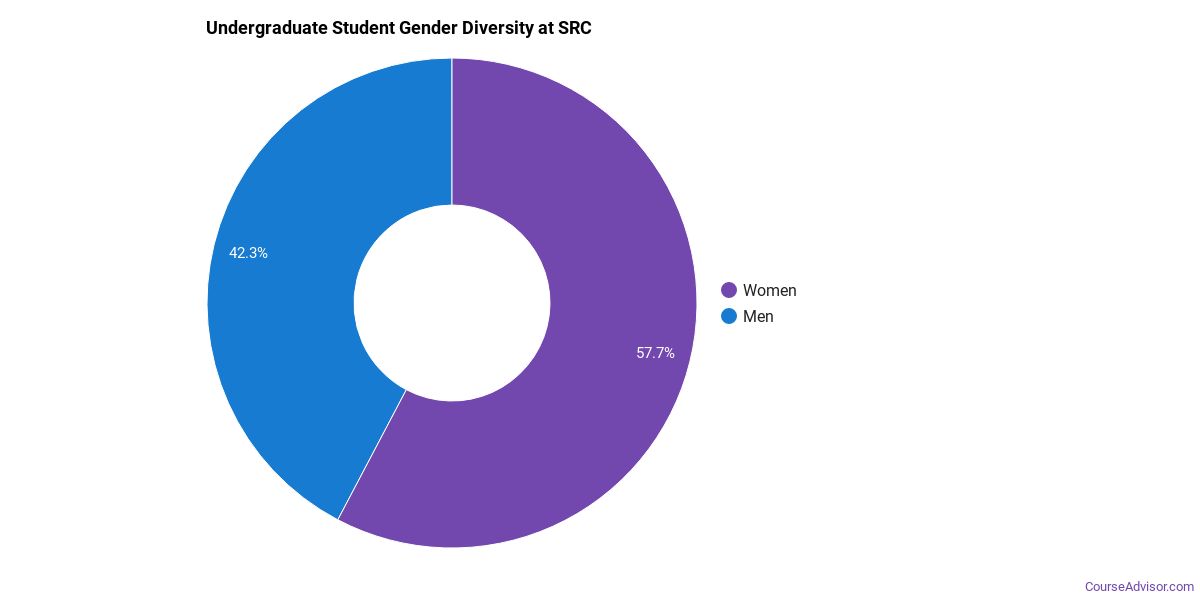
Gender Diversity
Of the 545 full-time undergraduates at SRC, 46% are male and 54% are female.
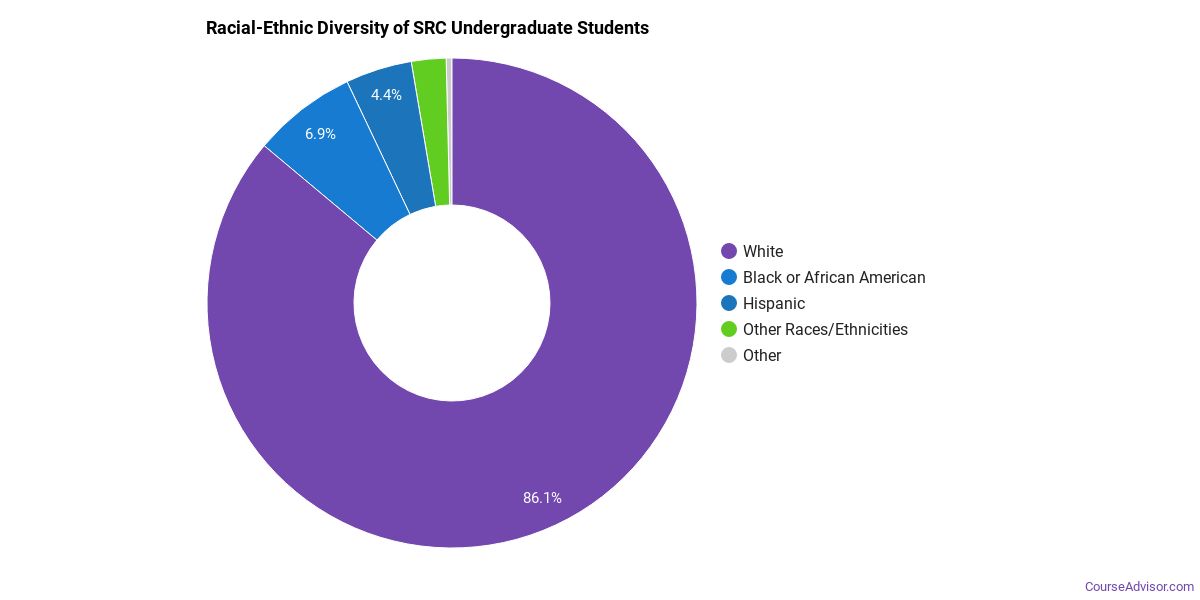
Racial-Ethnic Diversity
The racial-ethnic breakdown of Spoon River College students is as follows.
| Race/Ethnicity | Number of Grads |
|---|---|
| Asian | 2 |
| Black or African American | 54 |
| Hispanic or Latino | 21 |
| White | 455 |
| International Students | 0 |
| Other Races/Ethnicities | 13 |
Spoon River College Undergraduate Concentrations
The table below shows the number of awards for each concentration.
| Major | Basic Certificate | Associate’s | Undergraduate Certificate | TOTAL |
|---|---|---|---|---|
| Liberal Arts General Studies | 0 | 132 | 127 | 259 |
| Precision Metal Working | 57 | 0 | 0 | 57 |
| Information Technology | 54 | 0 | 0 | 54 |
| Practical Nursing & Nursing Assistants | 48 | 0 | 5 | 53 |
| Ground Transportation | 50 | 0 | 0 | 50 |
| Biological & Physical Science | 0 | 35 | 0 | 35 |
| Health & Medical Administrative Services | 9 | 3 | 8 | 20 |
| Agricultural Mechanization | 3 | 11 | 0 | 14 |
| Computer Information Systems | 7 | 7 | 0 | 14 |
| Computer Systems Networking | 10 | 0 | 0 | 10 |
| Entrepreneurial Studies | 8 | 1 | 0 | 9 |
| Allied Health Professions | 8 | 0 | 0 | 8 |
| Clinical/Medical Laboratory Science | 3 | 3 | 0 | 6 |
| Allied Health & Medical Assisting Services | 0 | 0 | 5 | 5 |
| Nursing | 0 | 5 | 0 | 5 |
| Agricultural Economics & Business | 0 | 3 | 0 | 3 |
| Agricultural Production | 3 | 0 | 0 | 3 |
| General Sales & Marketing | 1 | 0 | 0 | 1 |
| Human Development & Family Studies | 1 | 0 | 0 | 1 |
| Accounting | 0 | 0 | 0 | 0 |
| Business Administration & Management | 0 | 0 | 0 | 0 |
| Heavy/Industrial Equipment Maintenance | 0 | 0 | 0 | 0 |
| Natural Resource Management | 0 | 0 | 0 | 0 |
| TOTAL | 262 | 200 | 145 | 607 |
References
*The racial-ethnic minorities count is calculated by taking the total number of students and subtracting white students, international students, and students whose race/ethnicity was unknown. This number is then divided by the total number of students at the school to obtain the racial-ethnic minorities percentage.
More about our data sources and methodologies.
Course Advisor provides higher-education, college and university, degree, program, career, salary, and other helpful information to students, faculty, institutions, and other internet audiences. Presented information and data are subject to change. Inclusion on this website does not imply or represent a direct relationship with the company, school, or brand. Information, though believed correct at time of publication, may not be correct, and no warranty is provided. Contact the schools to verify any information before relying on it. Financial aid may be available for those who qualify. The displayed options may include sponsored or recommended results, not necessarily based on your preferences.
© Course Advisor – All Rights Reserved.