Statistics at Southern Methodist University
What traits are you looking for in a school for Statistics, you may want to check out the program at Southern Methodist University. The following information will help you decide if it is a good fit for you.
Southern Methodist University sits in Dallas, TX.
For the most recent IPEDS reporting year, 48 statistics degrees were granted at Southern Methodist University.
Featured schools near , edit
Online & Distance Learning at Southern Methodist University
Many students take online classes at Southern Methodist University. Among 12,116 students, 669 (6%) were enrolled entirely in distance education and 1,002 (8%) took at least some classes online.
Statistics Rankings at Southern Methodist University
These rankings give you a sense of how Southern Methodist University’s Statistics program against peer institutions.
Bachelor’s-Level Rankings
| Ranking | Scope | Rank |
|---|---|---|
| Best Schools (Quality) | Southwest (Region) | #3 of 14 |
| Best Schools (Quality) | Texas | #3 of 10 |
| Best Value | Texas | #10 of 10 |
| Best Value | Southwest (Region) | #14 of 14 |
| Best Schools (Quality) | Nationwide | #44 of 118 |
| Best Value | Nationwide | #113 of 116 |
Master’s-Level Rankings
| Ranking | Scope | Rank |
|---|---|---|
| Best Schools (Quality) | Southwest (Region) | #3 of 14 |
| Best Schools (Quality) | Texas | #3 of 10 |
| Best Value | Texas | #10 of 10 |
| Best Value | Southwest (Region) | #14 of 14 |
| Best Schools (Quality) | Nationwide | #44 of 118 |
| Best Value | Nationwide | #113 of 116 |
Doctoral-Level Rankings
| Ranking | Scope | Rank |
|---|---|---|
| Best Schools (Quality) | Southwest (Region) | #3 of 14 |
| Best Schools (Quality) | Texas | #3 of 10 |
| Best Value | Texas | #10 of 10 |
| Best Value | Southwest (Region) | #14 of 14 |
| Best Schools (Quality) | Nationwide | #44 of 118 |
| Best Value | Nationwide | #113 of 116 |
Median Debt at Graduation
Median student loan debt for Statistics graduates from Southern Methodist University comes in at $19,750.
Student Demographics & Diversity
Below you’ll find the diversity of Statistics graduates at Southern Methodist University, by degree type.
Looking at the program as a whole, Statistics graduates at Southern Methodist University are 44% women (21) and 56% men (27).
Statistics Bachelor’s Program at Southern Methodist University
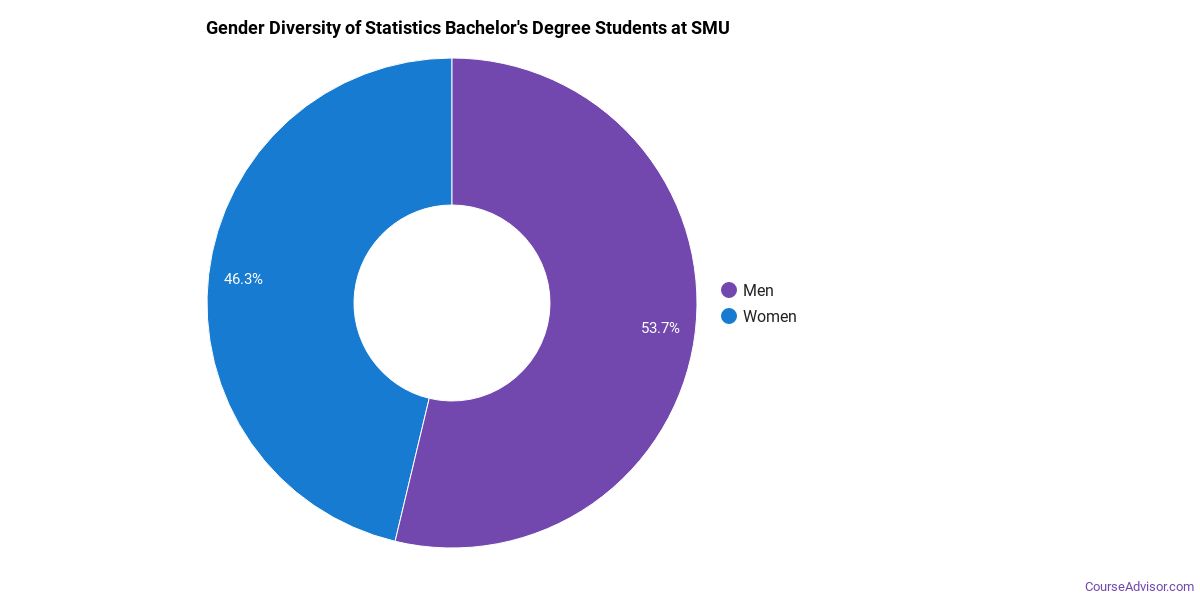
Among the 42 bachelor’s statistics degrees awarded at Southern Methodist University, 40% were women (17) and 60% were men (25).
The following table and chart show the race/ethnicity of Statistics bachelor’s degree recipients at Southern Methodist University.
| Race / Ethnicity | Number of Graduates |
|---|---|
| White | 21 |
| Hispanic / Latino | 4 |
| Asian | 7 |
| Native Hawaiian / Pacific Islander | 1 |
| Two or More Races | 2 |
| International (Nonresident) | 6 |
| Unknown | 1 |
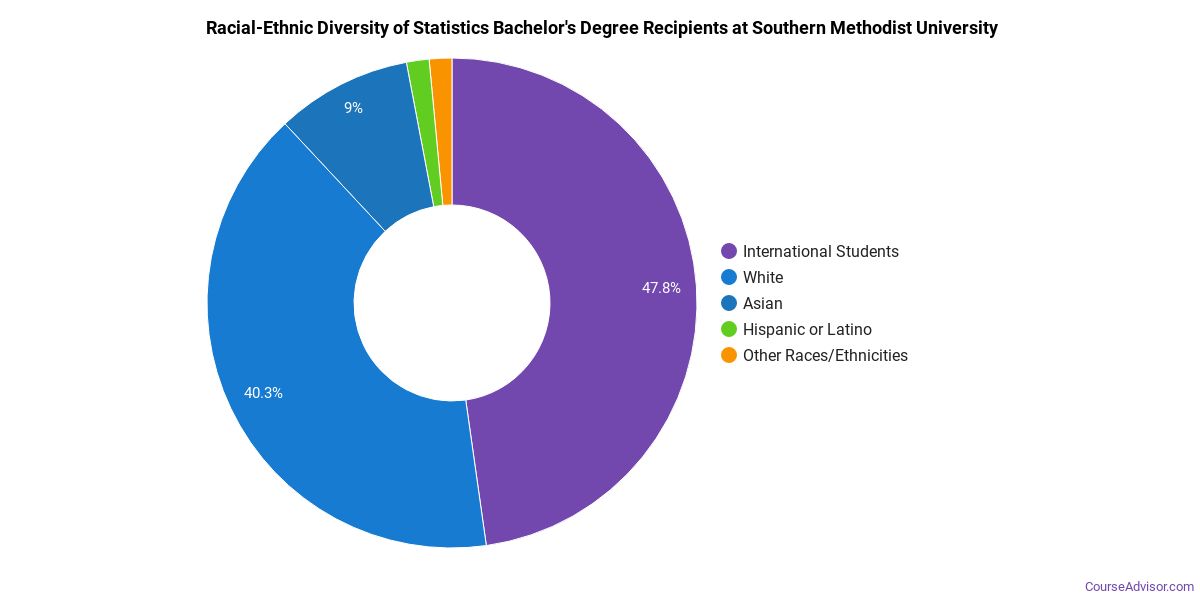
Racial-ethnic minorities make up 33% of Statistics bachelor’s degree recipients at Southern Methodist University, below the national average of 38%.*
Statistics Master’s Program at Southern Methodist University
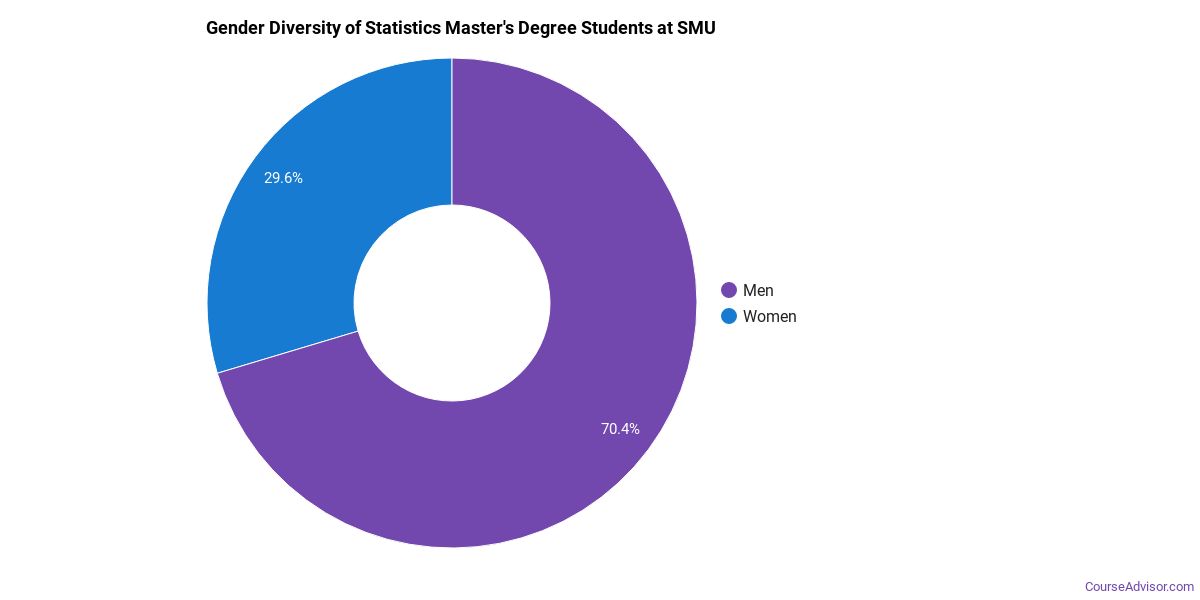
Among the 3 master’s statistics degrees awarded at Southern Methodist University, 67% were women (2) and 33% were men (1).
The following table and chart show the race/ethnicity of Statistics master’s degree recipients at Southern Methodist University.
| Race / Ethnicity | Number of Graduates |
|---|---|
| White | 2 |
| Asian | 1 |
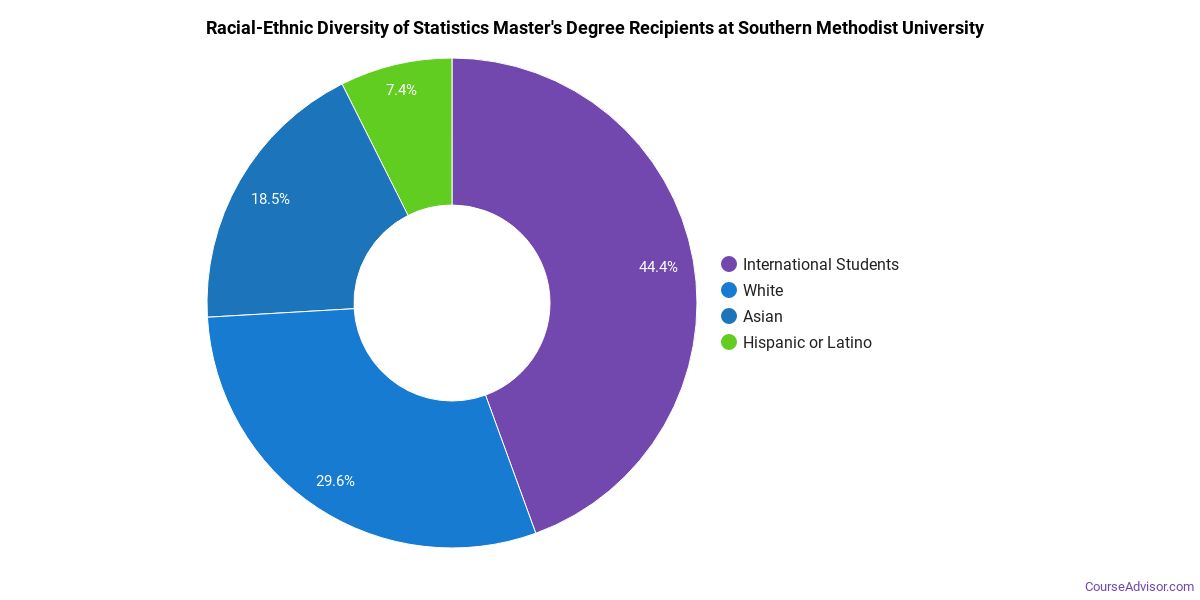
Minority students account for 33% of Statistics master’s degree recipients at Southern Methodist University, above the national average of 18%.*
Statistics Doctoral Program at Southern Methodist University
Among the 3 doctoral statistics graduates at Southern Methodist University, 67% were women (2) and 33% were men (1).

The following table and chart show the race/ethnicity of Statistics doctoral degree recipients at Southern Methodist University.
| Race / Ethnicity | Number of Graduates |
|---|---|
| International (Nonresident) | 3 |

*The racial-ethnic minorities figure is the total number of graduates minus White, international (nonresident), and unknown-race graduates.
More Specific Statistics Concentrations at Southern Methodist University
This Statistics program at Southern Methodist University offers more specialized concentrations:
| Concentration | Graduates |
|---|---|
| Statistics | 48 |
Top-Paying Careers for Statistics Graduates
Those who complete Statistics program at Southern Methodist University pursue many career paths. Below are the best-paid careers for Statistics graduates, ordered by median annual salary:
| Occupation | Nationwide Median Wage |
|---|---|
| Water Resource Specialists | $179,716 |
| Business Intelligence Analysts | $143,840 |
| Natural Sciences Managers | $132,227 |
| Statisticians | $130,349 |
| Biostatisticians | $121,594 |
| Clinical Research Coordinators | $110,931 |
| Survey Researchers | $108,538 |
| Data Scientists | $106,295 |
| Clinical Data Managers | $99,475 |
| Actuaries | $69,100 |
References
- IPEDS — Integrated Postsecondary Education Data System
- U.S. Department of Education — College Scorecard
- O*NET Online (Bureau of Labor Statistics)
- National Center for Education Statistics
More about our data sources and methodologies.
Course Advisor provides higher-education, college and university, degree, program, career, salary, and other helpful information to students, faculty, institutions, and other internet audiences. Presented information and data are subject to change. Inclusion on this website does not imply or represent a direct relationship with the company, school, or brand. Information, though believed correct at time of publication, may not be correct, and no warranty is provided. Contact the schools to verify any information before relying on it. Financial aid may be available for those who qualify. The displayed options may include sponsored or recommended results, not necessarily based on your preferences.
© Course Advisor – All Rights Reserved.