Film, Video & Photographic Arts at Southern Crescent Technical College
Southern Crescent Technical College is located in Griffin, Georgia and has a total student population of 5,232.
Want to know more about the career opportunities in this field? Check out the Careers in Film, Video & Photographic Arts section at the bottom of this page.
Featured Southern Crescent Technical College Programs
Learn about start dates, transferring credits, availability of financial aid, and more by contacting the universities below.
Take the first step toward a career of visual expression and doing what you love with this online associate degree from Southern New Hampshire University.

Learn to create a striking portfolio and hone the skills you need to succeed in the world of professional photography with this online digital photography degree from Southern New Hampshire University.
Southern Crescent Technical College Film, Video & Photographic Arts Degrees Available
- Basic Certificate in Film (Less Than 1 Year)
- Associate’s Degree in Film
Featured Southern Crescent Technical College Programs
Learn about start dates, transferring credits, availability of financial aid, and more by contacting the universities below.
Take the first step toward a career of visual expression and doing what you love with this online associate degree from Southern New Hampshire University.
Learn to create a striking portfolio and hone the skills you need to succeed in the world of professional photography with this online digital photography degree from Southern New Hampshire University.
Southern Crescent Technical College Film, Video & Photographic Arts Rankings
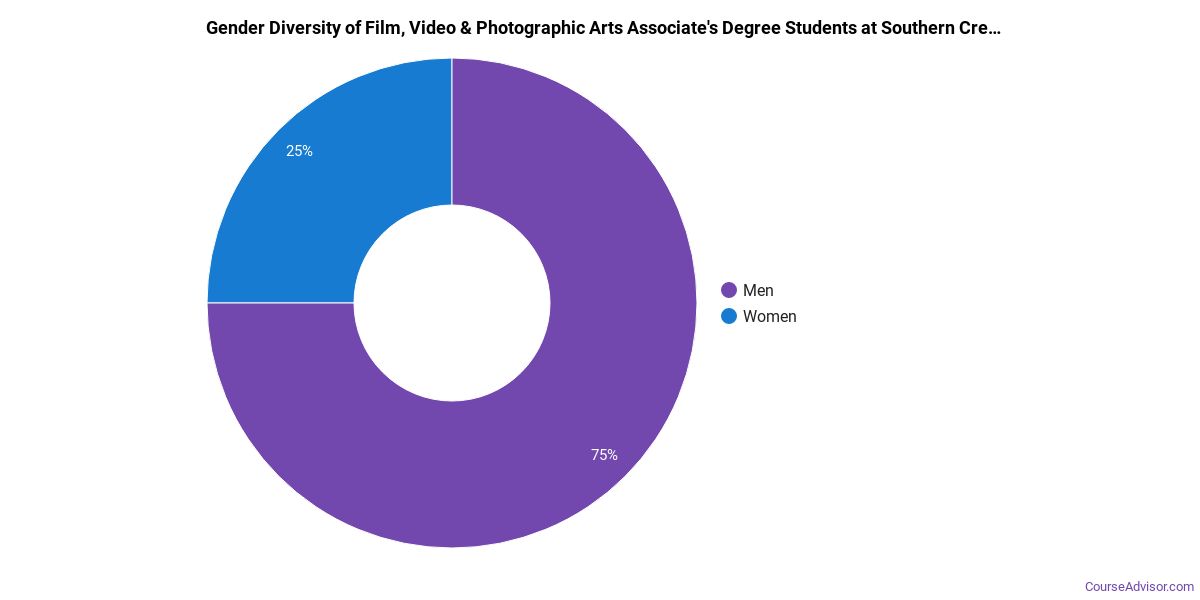
Film Student Demographics at Southern Crescent Technical College
Take a look at the following statistics related to the make-up of the film majors at Southern Crescent Technical College.
Southern Crescent Technical College Film, Video & Photographic Arts Associate’s Program
The majority of those who receive an associate's degree in film at Southern Crescent Technical College are white. Around 53% fell into this category, which is below average for this degree. Southern Crescent Technical College does a better job with serving racial-ethnic minorities than the typical school does. Its associate's program in film graduates 6% more racial-ethnic minorities than the nationwide average.*
The following table and chart show the race/ethnicity for students who recently graduated from Southern Crescent Technical College with a associate's in film.
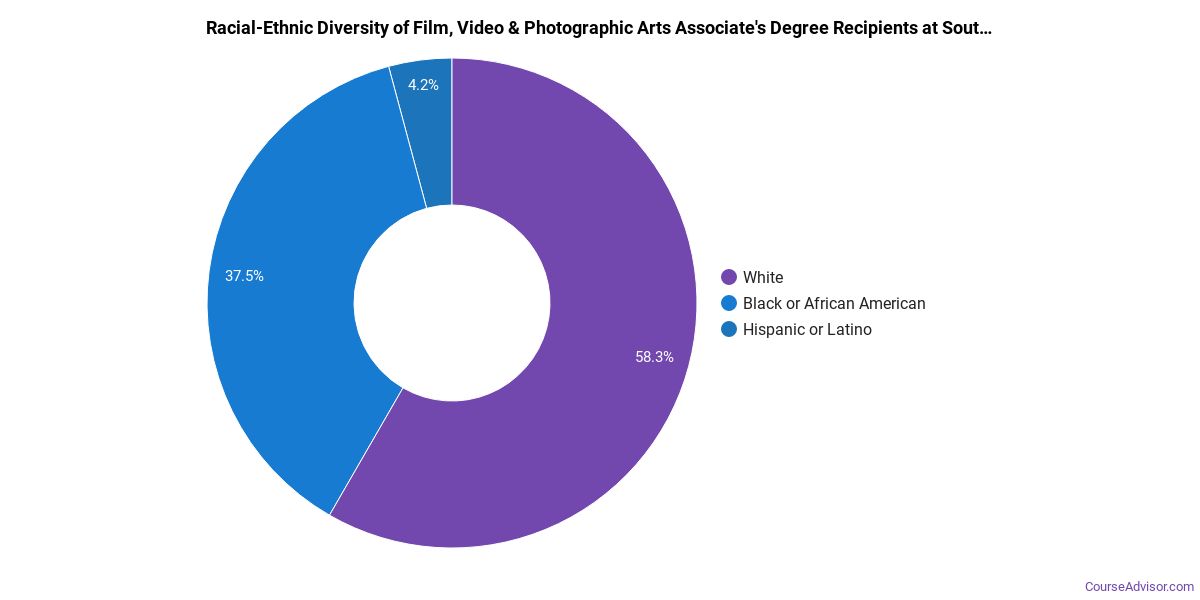
| Race/Ethnicity | Number of Students |
|---|---|
| Asian | 1 |
| Black or African American | 4 |
| Hispanic or Latino | 1 |
| White | 9 |
| International Students | 0 |
| Other Races/Ethnicities | 2 |
Concentrations Within Film, Video & Photographic Arts
If you plan to be a film major, you may want to focus your studies on one of the following concentrations. The completion numbers here include all graduates who receive any type of degree in this field from Southern Crescent Technical College. Some of these focus areas may not be available for your degree level.
| Concentration | Annual Degrees Awarded |
|---|---|
| Film & Video Production | 24 |
Related Majors
Related Programs
Learn about other programs related to Southern Crescent Technical College that might interest you.
BA in Graphic Design & Media Arts
Translate your creative ideas through concept, design and digital media with a bachelor's in graphic design online from Southern New Hampshire University.
Careers That Film Grads May Go Into
A degree in film can lead to the following careers. Since job numbers and average salaries can vary by geographic location, we have only included the numbers for GA, the home state for Southern Crescent Technical College.
| Occupation | Jobs in GA | Average Salary in GA |
|---|---|---|
| Producers and Directors | 4,900 | $84,570 |
| Photographers | 1,850 | $45,270 |
| Television, Video, and Motion Picture Camera Operators | 1,490 | $59,110 |
| Art, Drama, and Music Professors | 1,390 | $66,740 |
| Film and Video Editors | 1,330 | $64,470 |
References
*The racial-ethnic minorities count is calculated by taking the total number of students and subtracting white students, international students, and students whose race/ethnicity was unknown. This number is then divided by the total number of students at the school to obtain the racial-ethnic minorities percentage.
More about our data sources and methodologies.
Course Advisor provides higher-education, college and university, degree, program, career, salary, and other helpful information to students, faculty, institutions, and other internet audiences. Presented information and data are subject to change. Inclusion on this website does not imply or represent a direct relationship with the company, school, or brand. Information, though believed correct at time of publication, may not be correct, and no warranty is provided. Contact the schools to verify any information before relying on it. Financial aid may be available for those who qualify. The displayed options may include sponsored or recommended results, not necessarily based on your preferences.
© Course Advisor – All Rights Reserved.