Health Sciences & Services at Slippery Rock University of Pennsylvania
If you are interested in studying Health Sciences & Services, consider the program at Slippery Rock University of Pennsylvania. We’ve gathered the following information to help you decide.
Slippery Rock University of Pennsylvania is in Slippery Rock, PA.
For the most recent IPEDS reporting year, 124 health sciences & services degrees were granted at Slippery Rock University of Pennsylvania.
Featured schools near , edit
Online & Distance Learning at Slippery Rock University of Pennsylvania
Many students take online classes at Slippery Rock University of Pennsylvania. Among 8,376 students, 1,273 (15%) studied exclusively online and 2,697 (32%) took at least some classes online.
Health Sciences & Services Rankings at Slippery Rock University of Pennsylvania
Rankings can help you compare Slippery Rock University of Pennsylvania’s Health Sciences & Services program against peer institutions.
Bachelor’s-Level Rankings
| Ranking | Scope | Rank |
|---|---|---|
| Best Schools (Quality) | Pennsylvania | #8 of 24 |
| Best Value | Pennsylvania | #11 of 24 |
| Best Schools (Quality) | Middle Atlantic (Region) | #27 of 86 |
| Best Value | Middle Atlantic (Region) | #50 of 84 |
| Best Schools (Quality) | Nationwide | #107 of 478 |
| Best Value | Nationwide | #324 of 471 |
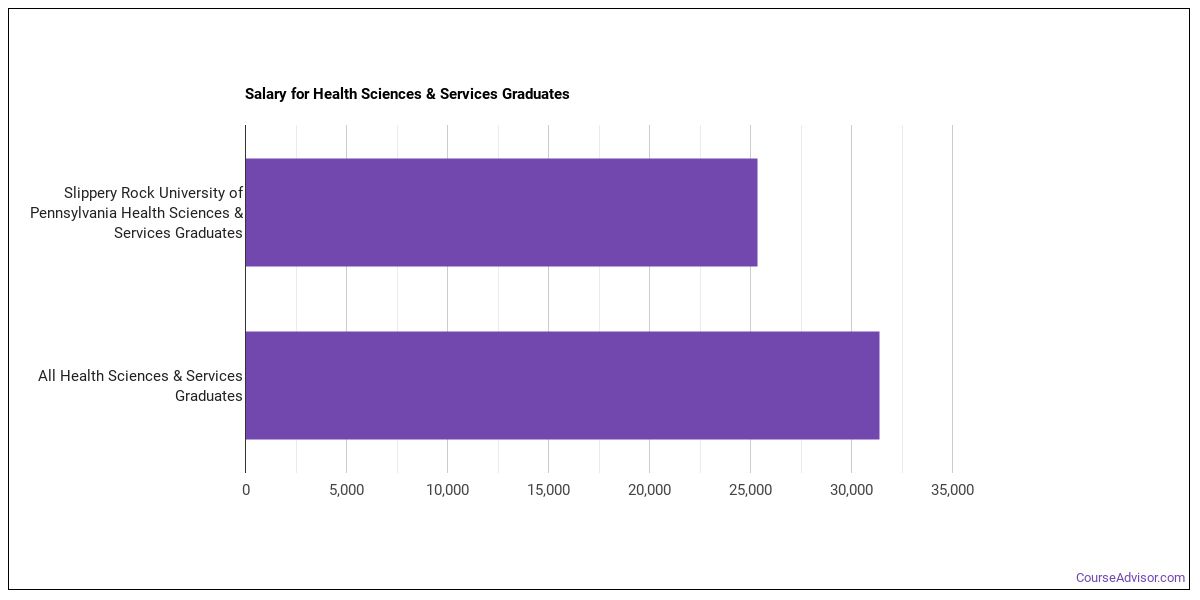
Earnings for Health Sciences & Services Graduates from Slippery Rock University of Pennsylvania
Those who finish Slippery Rock University of Pennsylvania’s Health Sciences & Services program earn at the following median levels (per the U.S. Department of Education’s College Scorecard):
| Years After Graduation | Median Earnings |
|---|---|
| 1 year | $25,368 |
| 2 years | $30,047 |
| 3 years | $46,972 |
| 4 years | $60,512 |
| 5 years | $71,272 |
Is this above or below average for the school? Four years after graduating, Health Sciences & Services graduates from Slippery Rock University of Pennsylvania take home a median $60,512, compared with $51,574 for all Slippery Rock University of Pennsylvania graduates — about 17% higher than the school-wide median.

Median Debt at Graduation
Median student loan debt for Health Sciences & Services graduates from Slippery Rock University of Pennsylvania comes in at $27,000.
Student Demographics & Diversity
Below you’ll find the student demographics for Health Sciences & Services graduates at Slippery Rock University of Pennsylvania, broken down by degree level.
Program-wide, Health Sciences & Services graduates at Slippery Rock University of Pennsylvania are 70% women (87) and 30% men (37).
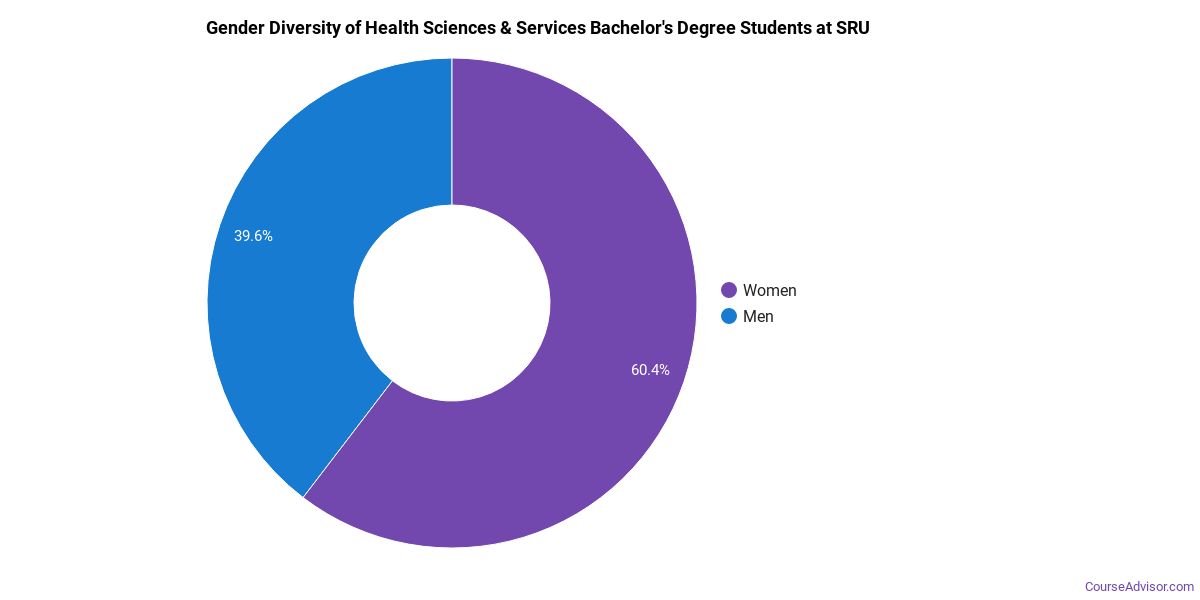
Health Sciences & Services Bachelor’s Program at Slippery Rock University of Pennsylvania
Of the 118 bachelor’s health sciences & services graduates at Slippery Rock University of Pennsylvania, 70% were women (83) and 30% were men (35).
The following table and chart show the race/ethnicity of Health Sciences & Services bachelor’s degree recipients at Slippery Rock University of Pennsylvania.
| Race / Ethnicity | Number of Graduates |
|---|---|
| White | 102 |
| Hispanic / Latino | 4 |
| Black / African American | 2 |
| Asian | 1 |
| Two or More Races | 7 |
| Unknown | 2 |
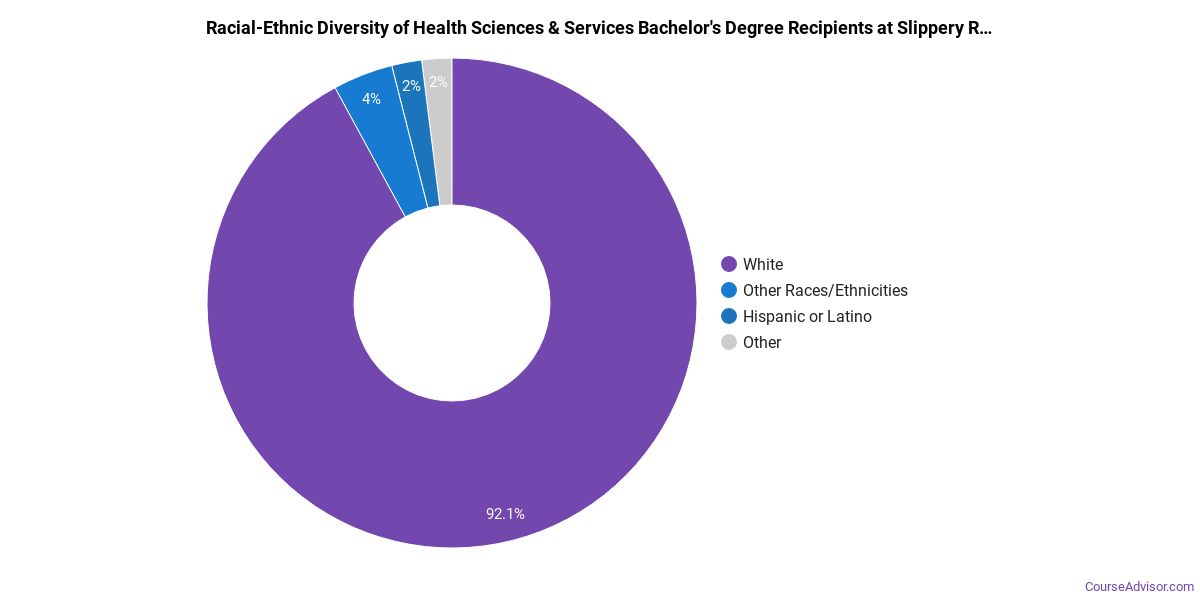
Racial-ethnic minorities make up 12% of Health Sciences & Services bachelor’s degree recipients at Slippery Rock University of Pennsylvania, below the national average of 50%.*
Health Sciences & Services Master’s Program at Slippery Rock University of Pennsylvania
Among the 6 master’s health sciences & services degrees awarded at Slippery Rock University of Pennsylvania, 67% were women (4) and 33% were men (2).

The following table and chart show the race/ethnicity of Health Sciences & Services master’s degree recipients at Slippery Rock University of Pennsylvania.
| Race / Ethnicity | Number of Graduates |
|---|---|
| White | 5 |
| Hispanic / Latino | 1 |

Minority students account for 17% of Health Sciences & Services master’s degree recipients at Slippery Rock University of Pennsylvania, lower than the national average of 57%.*
*The racial-ethnic minorities figure is the total number of graduates minus White, international (nonresident), and unknown-race graduates.
More Specific Health Sciences & Services Concentrations at Slippery Rock University of Pennsylvania
The Health Sciences & Services program at Slippery Rock University of Pennsylvania offers more specialized concentrations:
| Concentration | Graduates |
|---|---|
| General Health & Wellness | 124 |
Highest-Paying Careers for Health Sciences & Services Graduates
Those who complete Health Sciences & Services program at Slippery Rock University of Pennsylvania work across a variety of fields. Here are the highest-paying careers for Health Sciences & Services majors, ordered by median annual salary:
| Occupation | Nationwide Median Wage |
|---|---|
| Health Education Specialists | $81,726 |
| Community Health Workers | $73,901 |
References
- IPEDS — Integrated Postsecondary Education Data System
- U.S. Department of Education — College Scorecard
- O*NET Online (Bureau of Labor Statistics)
- National Center for Education Statistics
More about our data sources and methodologies.
Course Advisor provides higher-education, college and university, degree, program, career, salary, and other helpful information to students, faculty, institutions, and other internet audiences. Presented information and data are subject to change. Inclusion on this website does not imply or represent a direct relationship with the company, school, or brand. Information, though believed correct at time of publication, may not be correct, and no warranty is provided. Contact the schools to verify any information before relying on it. Financial aid may be available for those who qualify. The displayed options may include sponsored or recommended results, not necessarily based on your preferences.
© Course Advisor – All Rights Reserved.