General Social Sciences at Shawnee State University
What traits are you looking for in a school for General Social Sciences, consider the program at Shawnee State University. We’ve gathered the following information to help you decide.
Shawnee State University is in Portsmouth, OH.
During the most recent reporting year, 10 general social sciences degrees were granted at Shawnee State University.
Featured schools near , edit
Online & Distance Learning at Shawnee State University
Online coursework is an option at Shawnee State University. Among 3,231 students, 570 (18%) studied exclusively online and 1,512 (47%) took at least some classes online.
General Social Sciences Rankings at Shawnee State University
These rankings give you a sense of how Shawnee State University’s General Social Sciences program to other colleges that offer this major.
Bachelor’s-Level Rankings
| Ranking | Scope | Rank |
|---|---|---|
| Best Value | Ohio | #2 of 5 |
| Best Schools (Quality) | Ohio | #5 of 5 |
| Best Value | Great Lakes (Region) | #7 of 13 |
| Best Schools (Quality) | Great Lakes (Region) | #13 of 13 |
| Best Value | Nationwide | #120 of 156 |
| Best Schools (Quality) | Nationwide | #154 of 155 |
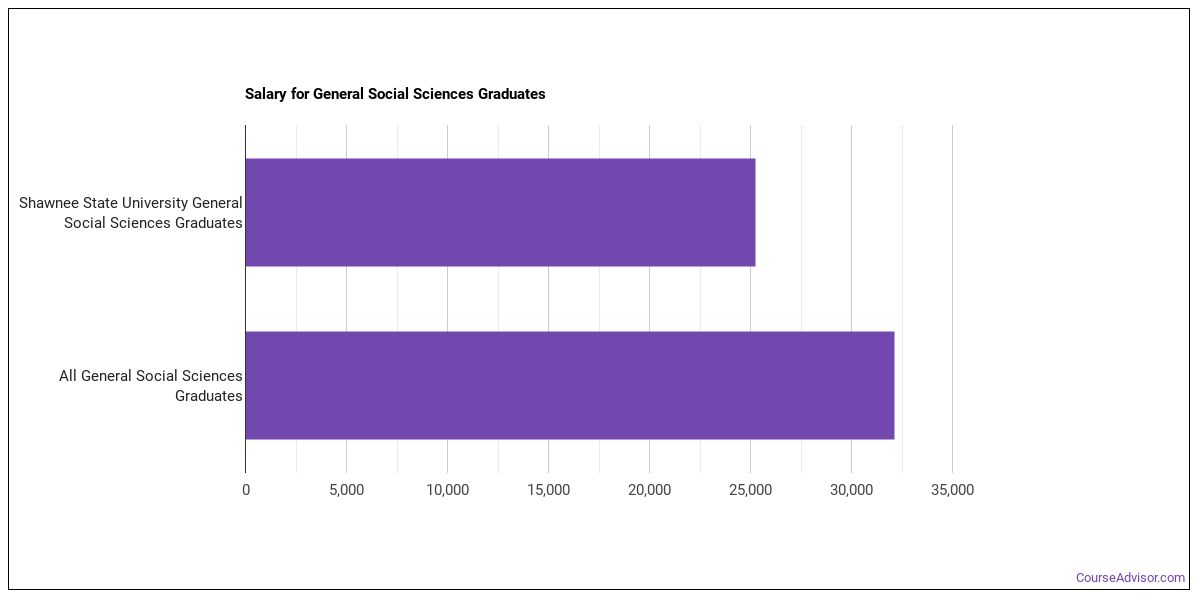
Earnings for General Social Sciences Graduates from Shawnee State University
Students who complete Shawnee State University’s General Social Sciences program report the following median earnings (per the U.S. Department of Education’s College Scorecard):
| Years After Graduation | Median Earnings |
|---|---|
| 1 year | $25,236 |
| 2 years | $21,964 |
| 3 years | $30,970 |
| 4 years | $34,938 |
| 5 years | $37,841 |
How do these earnings stack up against the rest of the school? At the four-year mark, General Social Sciences graduates from Shawnee State University earn a median of $34,938, compared with $48,069 for all Shawnee State University graduates — about 27% lower than the school-wide median.

Student Demographics & Diversity
Below you’ll find the student demographics for General Social Sciences graduates at Shawnee State University, broken down by degree level.
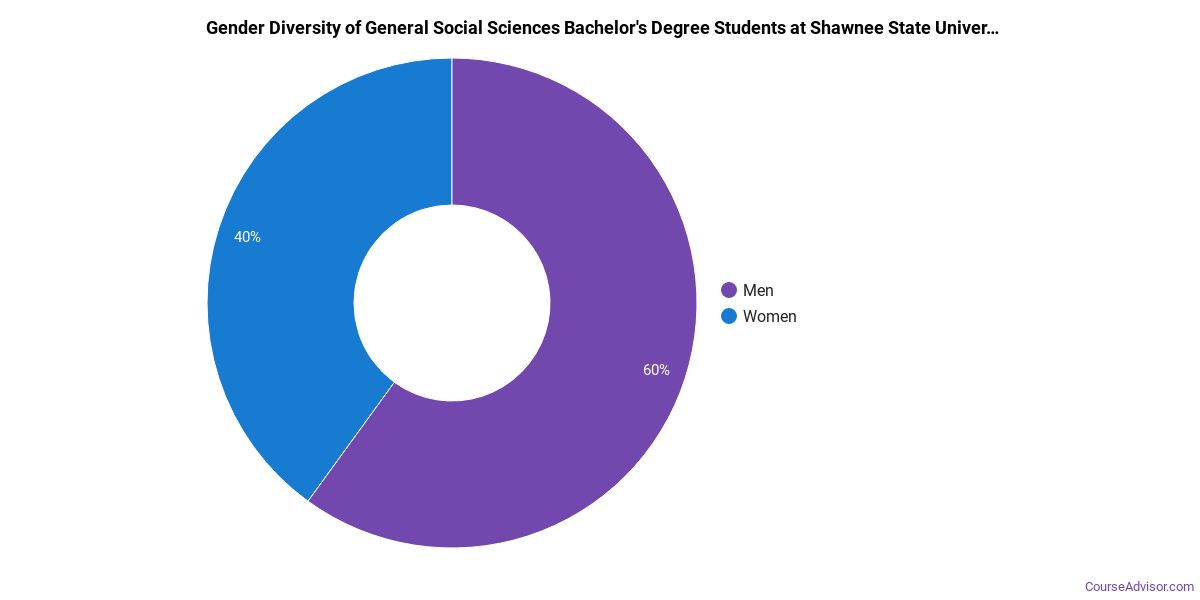
Looking at the program as a whole, General Social Sciences graduates at Shawnee State University are 50% women (5) and 50% men (5).
General Social Sciences Bachelor’s Program at Shawnee State University
Of the 10 bachelor’s general social sciences graduates at Shawnee State University, 50% were women (5) and 50% were men (5).
The following table and chart show the race/ethnicity of General Social Sciences bachelor’s degree recipients at Shawnee State University.
| Race / Ethnicity | Number of Graduates |
|---|---|
| White | 9 |
| Unknown | 1 |
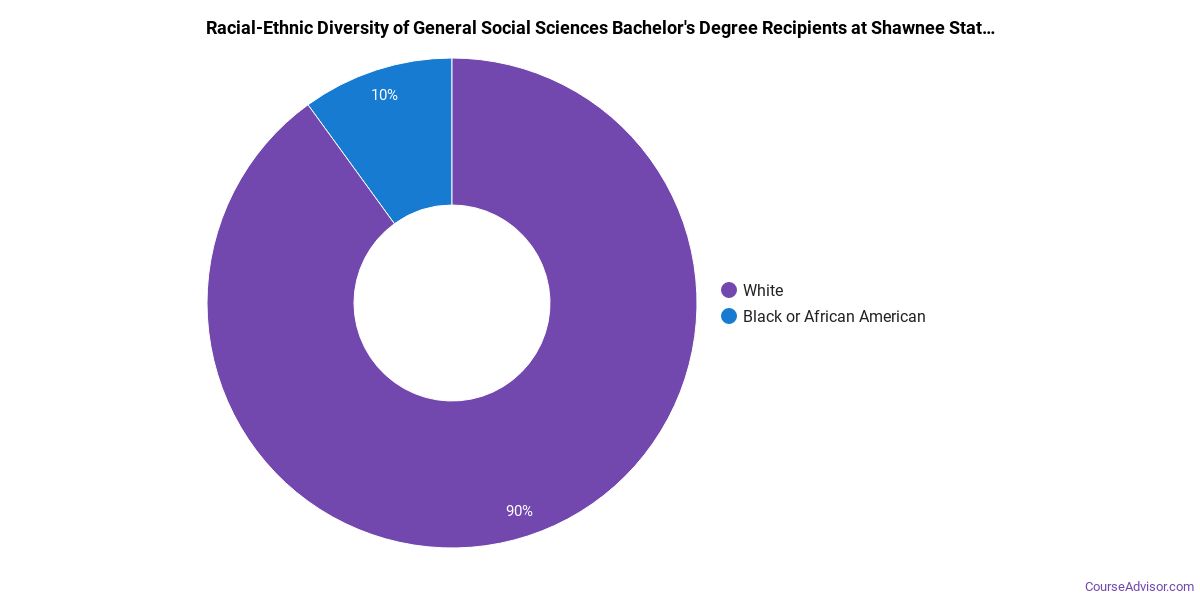
*The racial-ethnic minorities figure is the total number of graduates minus White, international (nonresident), and unknown-race graduates.
More Specific General Social Sciences Concentrations at Shawnee State University
The General Social Sciences program at Shawnee State University breaks down into more specific concentrations:
| Concentration | Graduates |
|---|---|
| General Social Sciences | 10 |
Highest-Paying Careers for General Social Sciences Graduates
Those who complete General Social Sciences program at Shawnee State University work across a variety of fields. Here are the highest-paying careers for General Social Sciences graduates, ordered by median annual salary:
| Occupation | Nationwide Median Wage |
|---|---|
| Wind Energy Development Managers | $169,952 |
| Loss Prevention Managers | $165,723 |
| Statisticians | $130,349 |
| Wind Energy Operations Managers | $122,567 |
| Biostatisticians | $121,594 |
| Compliance Managers | $117,178 |
| Survey Researchers | $108,538 |
| Brownfield Redevelopment Specialists and Site Managers | $99,321 |
| Managers, All Other | $95,684 |
| Middle School Teachers, Except Special and Career/Technical Education | $83,105 |
References
- IPEDS — Integrated Postsecondary Education Data System
- U.S. Department of Education — College Scorecard
- O*NET Online (Bureau of Labor Statistics)
- National Center for Education Statistics
More about our data sources and methodologies.
Course Advisor provides higher-education, college and university, degree, program, career, salary, and other helpful information to students, faculty, institutions, and other internet audiences. Presented information and data are subject to change. Inclusion on this website does not imply or represent a direct relationship with the company, school, or brand. Information, though believed correct at time of publication, may not be correct, and no warranty is provided. Contact the schools to verify any information before relying on it. Financial aid may be available for those who qualify. The displayed options may include sponsored or recommended results, not necessarily based on your preferences.
© Course Advisor – All Rights Reserved.