General Psychology at Seattle University
If you are interested in studying General Psychology, you may want to check out the program at Seattle University. We’ve gathered the following information to help you decide.
Seattle University is located in Seattle, WA.
For the most recent IPEDS reporting year, 88 general psychology graduations were recorded at Seattle University.
Featured schools near , edit
Online & Distance Learning at Seattle University
Online coursework is an option at Seattle University. Of 7,189 students, 564 (8%) were enrolled entirely in distance education and 915 (13%) took at least some classes online.
General Psychology Rankings at Seattle University
These rankings give you a sense of how Seattle University’s General Psychology program against other schools offering the same major.
Bachelor’s-Level Rankings
| Ranking | Scope | Rank |
|---|---|---|
| Best Schools (Quality) | Washington | #3 of 18 |
| Best Value | Washington | #15 of 17 |
| Best Schools (Quality) | Far Western (Region) | #17 of 210 |
| Best Schools (Quality) | Nationwide | #74 of 1,305 |
| Best Value | Far Western (Region) | #194 of 206 |
| Best Value | Nationwide | #1228 of 1,295 |
Master’s-Level Rankings
| Ranking | Scope | Rank |
|---|---|---|
| Best Schools (Quality) | Washington | #3 of 18 |
| Best Value | Washington | #15 of 17 |
| Best Schools (Quality) | Far Western (Region) | #17 of 210 |
| Best Schools (Quality) | Nationwide | #74 of 1,305 |
| Best Value | Far Western (Region) | #194 of 206 |
| Best Value | Nationwide | #1228 of 1,295 |
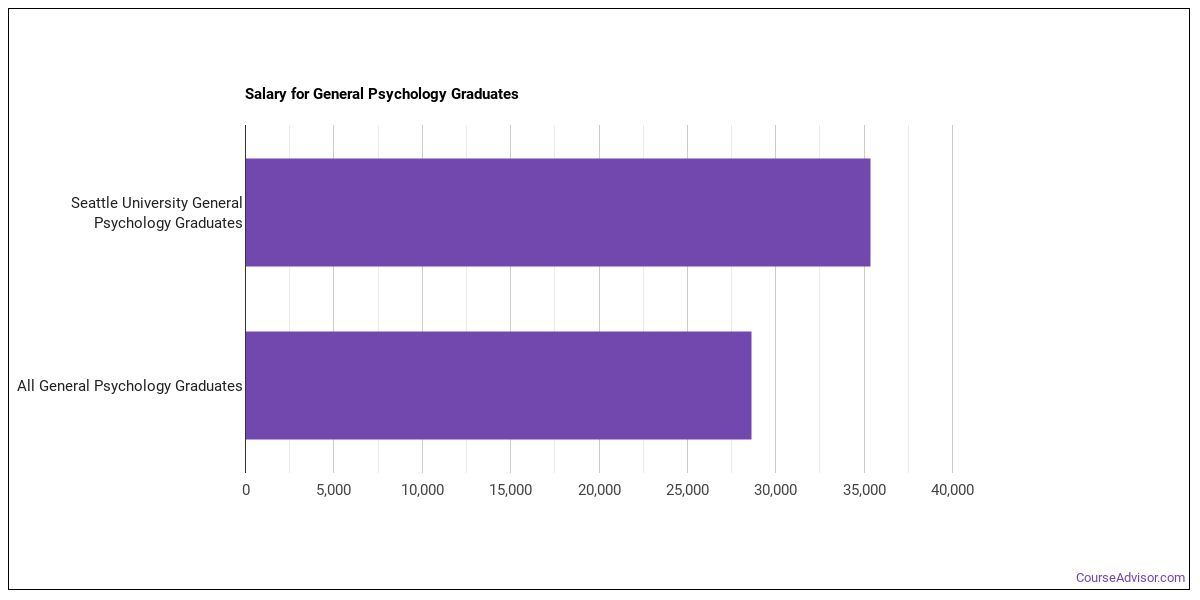
Earnings for General Psychology Graduates from Seattle University
Students who complete Seattle University’s General Psychology program earn the following amounts (per the U.S. Department of Education’s College Scorecard):
| Years After Graduation | Median Earnings |
|---|---|
| 1 year | $36,871 |
| 2 years | $34,704 |
| 3 years | $41,889 |
| 4 years | $51,008 |
| 5 years | $58,750 |
How does this compare to the school overall? Four years out, General Psychology graduates from Seattle University report median earnings of $51,008, compared with $82,033 for all Seattle University graduates — about 38% lower than the school-wide median.

Median Debt at Graduation
Median student loan debt for General Psychology graduates from Seattle University stands at $19,500.
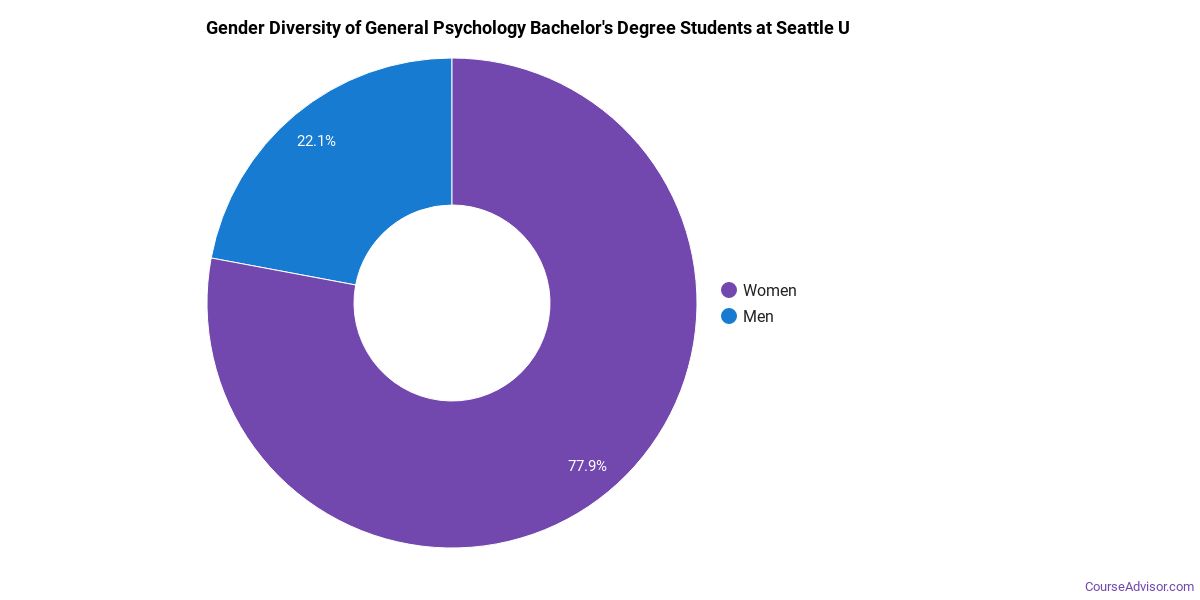
Student Demographics & Diversity
Take a look at the composition of General Psychology graduates at Seattle University, by degree type.
Looking at the program as a whole, General Psychology graduates at Seattle University are 70% women (62) and 30% men (26).
General Psychology Bachelor’s Program at Seattle University
Among the 72 bachelor’s general psychology degrees awarded at Seattle University, 72% were women (52) and 28% were men (20).
The following table and chart show the race/ethnicity of General Psychology bachelor’s degree recipients at Seattle University.
| Race / Ethnicity | Number of Graduates |
|---|---|
| White | 28 |
| Hispanic / Latino | 9 |
| Black / African American | 7 |
| Asian | 12 |
| Two or More Races | 9 |
| International (Nonresident) | 6 |
| Unknown | 1 |
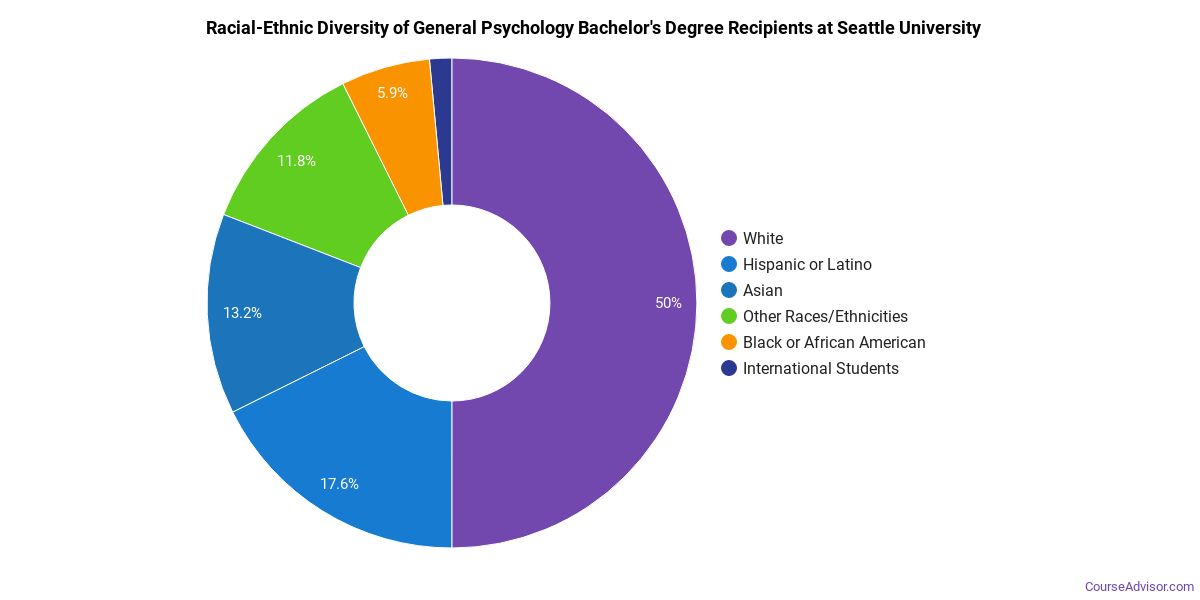
Racial-ethnic minorities make up 51% of General Psychology bachelor’s degree recipients at Seattle University, above the national average of 46%.*
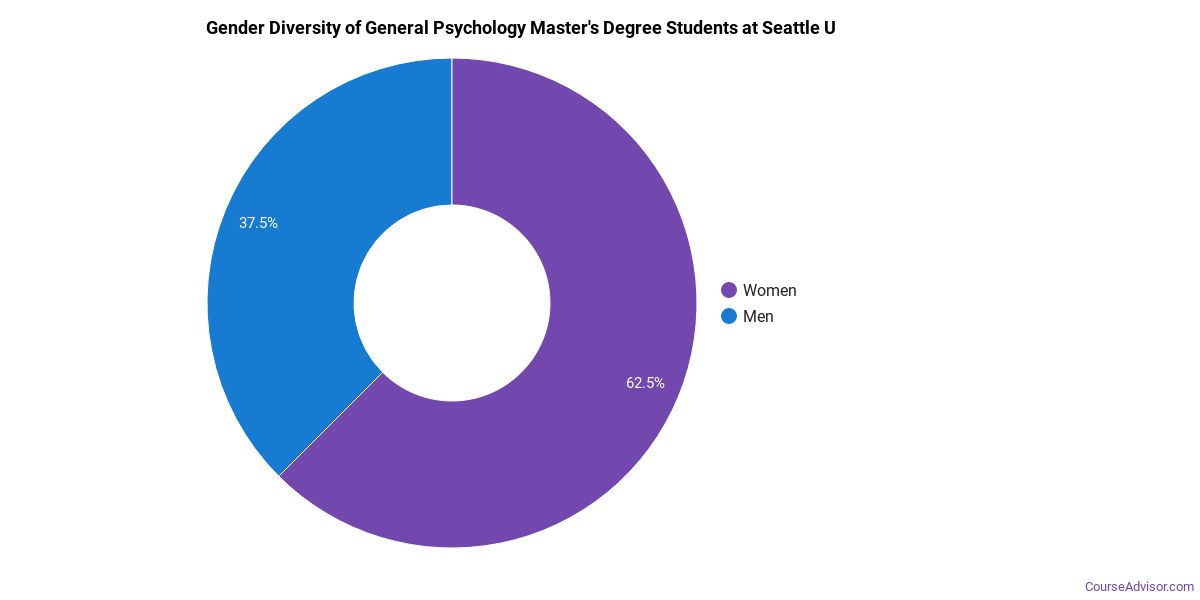
General Psychology Master’s Program at Seattle University
Among the 16 master’s general psychology degrees awarded at Seattle University, 62% were women (10) and 38% were men (6).
The following table and chart show the race/ethnicity of General Psychology master’s degree recipients at Seattle University.
| Race / Ethnicity | Number of Graduates |
|---|---|
| White | 10 |
| Hispanic / Latino | 2 |
| Two or More Races | 3 |
| International (Nonresident) | 1 |
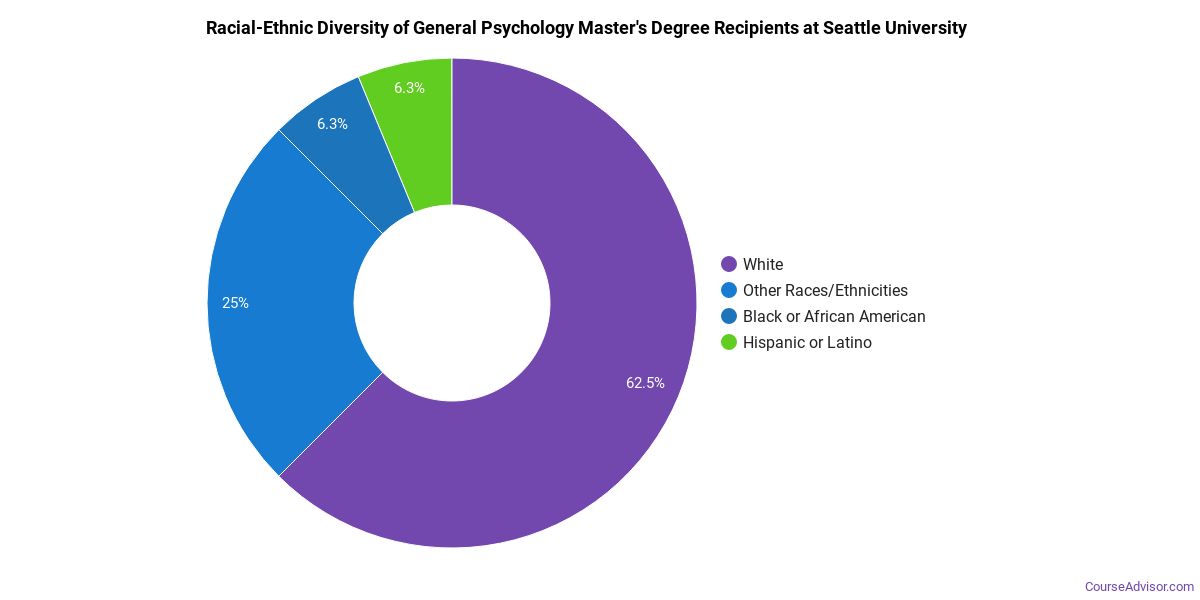
Racial-ethnic minorities make up 31% of General Psychology master’s degree recipients at Seattle University, lower than the national average of 39%.*
*The racial-ethnic minorities figure is the total number of graduates minus White, international (nonresident), and unknown-race graduates.
More Specific General Psychology Concentrations at Seattle University
The General Psychology program at Seattle University breaks down into more specific concentrations:
| Concentration | Graduates |
|---|---|
| General Psychology | 88 |
Top-Paying Careers for General Psychology Graduates
Those who complete General Psychology program at Seattle University go on to a range of careers. Here are the top-paying careers for General Psychology majors, ordered by median annual salary:
| Occupation | Nationwide Median Wage |
|---|---|
| Wind Energy Development Managers | $169,952 |
| Loss Prevention Managers | $165,723 |
| Wind Energy Operations Managers | $122,567 |
| Compliance Managers | $117,178 |
| Brownfield Redevelopment Specialists and Site Managers | $99,321 |
| Psychology Teachers, Postsecondary | $98,479 |
| Managers, All Other | $95,684 |
| Neuropsychologists | $83,690 |
| Regulatory Affairs Managers | $77,828 |
| Psychologists, All Other | $73,521 |
References
- IPEDS — Integrated Postsecondary Education Data System
- U.S. Department of Education — College Scorecard
- O*NET Online (Bureau of Labor Statistics)
- National Center for Education Statistics
More about our data sources and methodologies.
Course Advisor provides higher-education, college and university, degree, program, career, salary, and other helpful information to students, faculty, institutions, and other internet audiences. Presented information and data are subject to change. Inclusion on this website does not imply or represent a direct relationship with the company, school, or brand. Information, though believed correct at time of publication, may not be correct, and no warranty is provided. Contact the schools to verify any information before relying on it. Financial aid may be available for those who qualify. The displayed options may include sponsored or recommended results, not necessarily based on your preferences.
© Course Advisor – All Rights Reserved.