Mathematics at San Jose State University
San Jose State is located in San Jose, California and approximately 36,208 students attend the school each year.
Want to know more about the career opportunities in this field? Check out the Careers in Mathematics section at the bottom of this page.
Featured San Jose State University Programs
Learn about start dates, transferring credits, availability of financial aid, and more by contacting the universities below.
If you have a knack for mathematics and an interest in learning more, study online to achieve your career goals at Southern New Hampshire University. Our mathematics degree can help you enhance your mathematical abilities, including reasoning and problem-solving in three areas: analysis, algebra and statistics.

BA in Mathematics - Applied Mathematics
Put mathematical concepts to work to solve today's most complex real-world problems by studying applied mathematics with this specialized online bachelor's from Southern New Hampshire University.
San Jose State Mathematics Degrees Available
- Bachelor’s Degree in Math
- Master’s Degree in Math
Featured San Jose State University Programs
Learn about start dates, transferring credits, availability of financial aid, and more by contacting the universities below.
If you have a knack for mathematics and an interest in learning more, study online to achieve your career goals at Southern New Hampshire University. Our mathematics degree can help you enhance your mathematical abilities, including reasoning and problem-solving in three areas: analysis, algebra and statistics.
BA in Mathematics - Applied Mathematics
Put mathematical concepts to work to solve today's most complex real-world problems by studying applied mathematics with this specialized online bachelor's from Southern New Hampshire University.
San Jose State Mathematics Rankings
The math major at San Jose State is not ranked on College Factual’s Best Colleges and Universities for Mathematics. This could be for a number of reasons, such as not having enough data on the major or school to make an accurate assessment of its quality.
Math Student Demographics at San Jose State
Take a look at the following statistics related to the make-up of the math majors at San Jose State University.
San Jose State Mathematics Bachelor’s Program
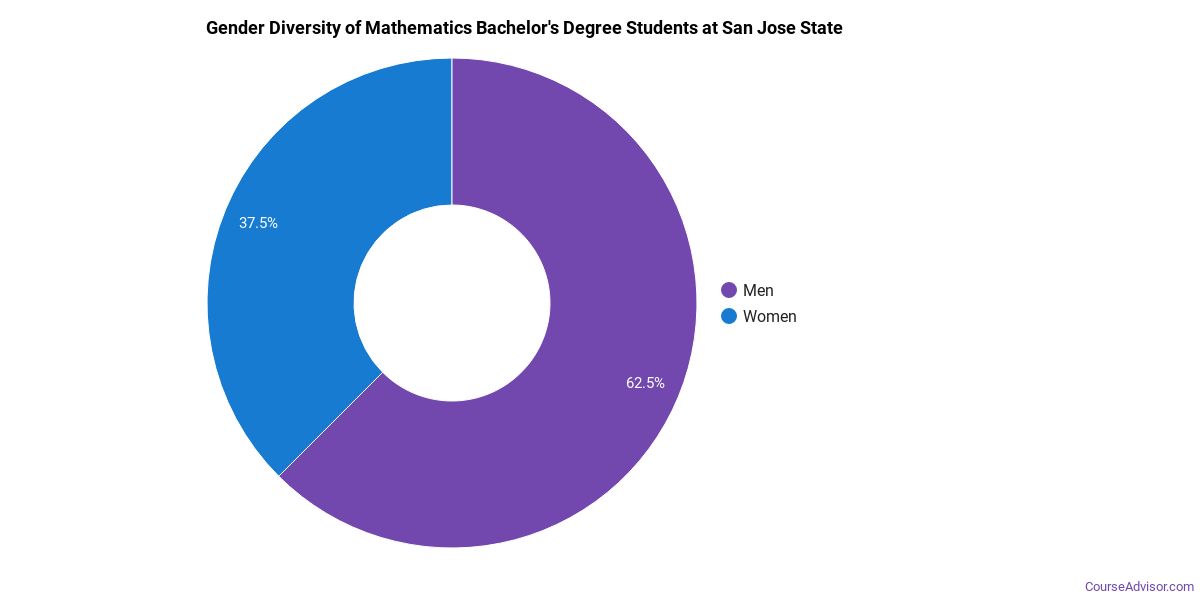
Prospective students may be interested in knowing that this school graduates 40% more racial-ethnic minorities in its math bachelor's program than the national average.*
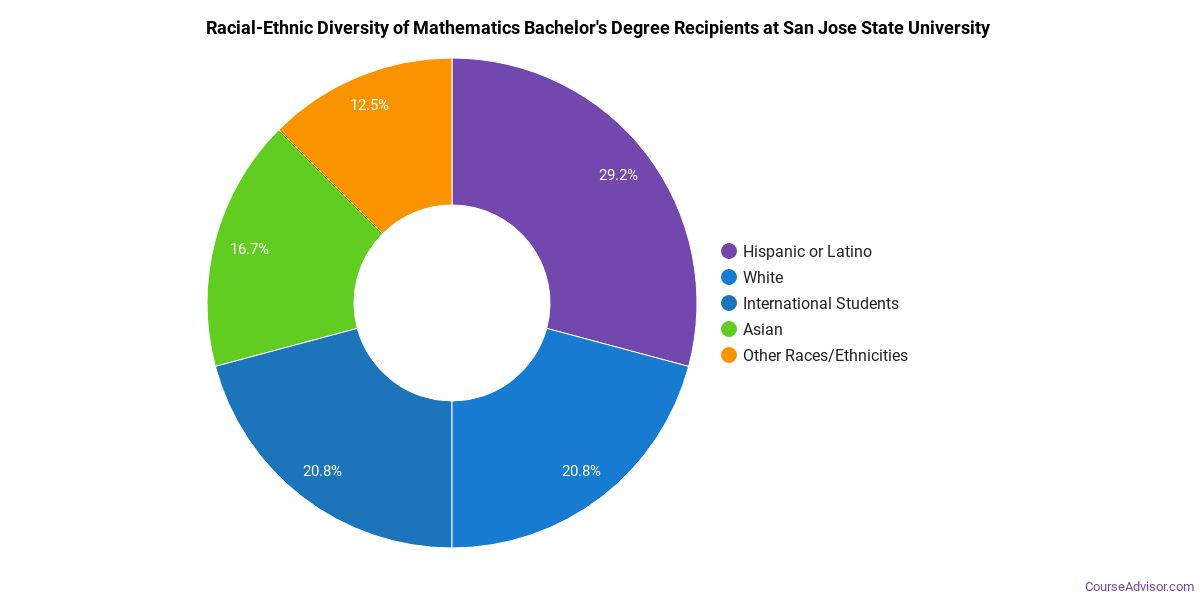
The following table and chart show the race/ethnicity for students who recently graduated from San Jose State University with a bachelor's in math.
| Race/Ethnicity | Number of Students |
|---|---|
| Asian | 11 |
| Black or African American | 0 |
| Hispanic or Latino | 3 |
| White | 2 |
| International Students | 2 |
| Other Races/Ethnicities | 2 |
San Jose State Mathematics Master’s Program
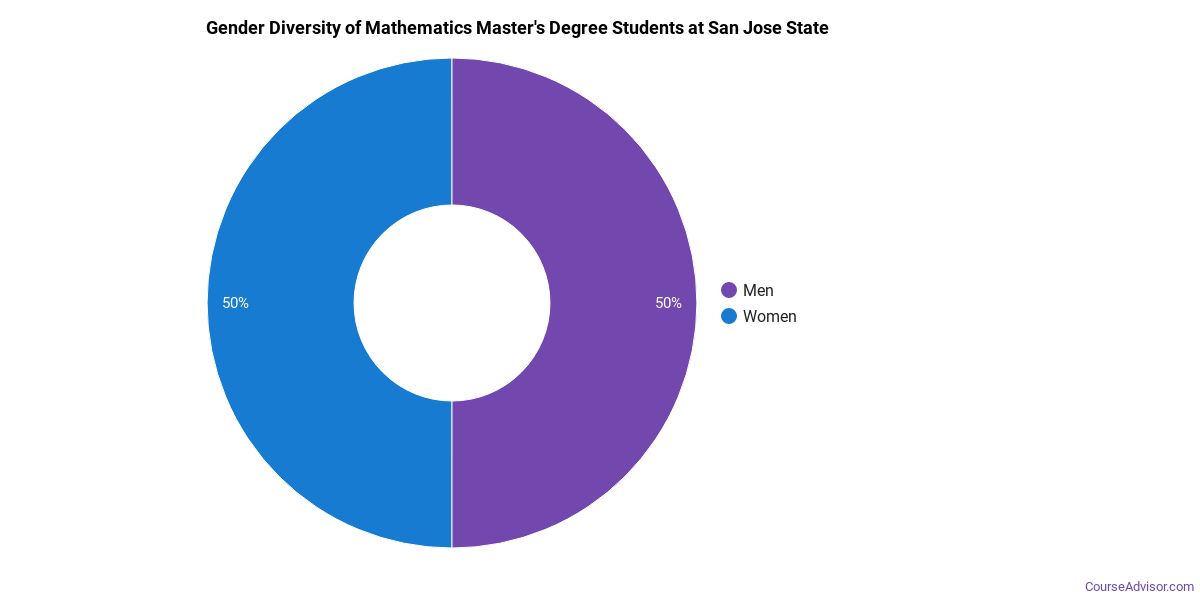
In the math master's program at this school, racial-ethnic minorities make up 60% of degree recipients. That is 25% better than the national average.*
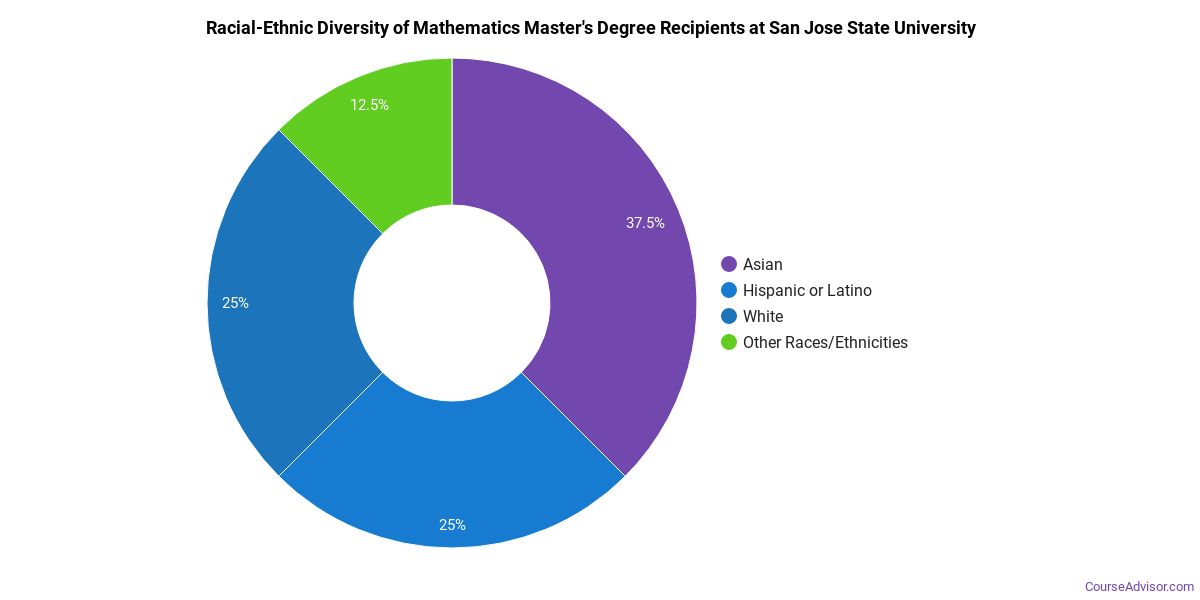
The following table and chart show the race/ethnicity for students who recently graduated from San Jose State University with a master's in math.
| Race/Ethnicity | Number of Students |
|---|---|
| Asian | 1 |
| Black or African American | 0 |
| Hispanic or Latino | 2 |
| White | 1 |
| International Students | 0 |
| Other Races/Ethnicities | 1 |
Concentrations Within Mathematics
The following math concentations are available at San Jose State University. The completion numbers here include all graduates who receive any type of degree in this field from San Jose State University. Some of these focus areas may not be available for your degree level.
| Concentration | Annual Degrees Awarded |
|---|---|
| General Mathematics | 32 |
Related Majors
Careers That Math Grads May Go Into
A degree in math can lead to the following careers. Since job numbers and average salaries can vary by geographic location, we have only included the numbers for CA, the home state for San Jose State University.
| Occupation | Jobs in CA | Average Salary in CA |
|---|---|---|
| High School Teachers | 112,960 | $80,510 |
| Natural Sciences Managers | 7,870 | $168,790 |
| Statisticians | 5,650 | $99,860 |
| Mathematical Science Professors | 5,160 | $127,480 |
| Mathematicians | 530 | $100,000 |
References
*The racial-ethnic minorities count is calculated by taking the total number of students and subtracting white students, international students, and students whose race/ethnicity was unknown. This number is then divided by the total number of students at the school to obtain the racial-ethnic minorities percentage.
- College Factual
- National Center for Education Statistics
- O*NET Online
- Image Credit: By Daderot under License
More about our data sources and methodologies.
Course Advisor provides higher-education, college and university, degree, program, career, salary, and other helpful information to students, faculty, institutions, and other internet audiences. Presented information and data are subject to change. Inclusion on this website does not imply or represent a direct relationship with the company, school, or brand. Information, though believed correct at time of publication, may not be correct, and no warranty is provided. Contact the schools to verify any information before relying on it. Financial aid may be available for those who qualify. The displayed options may include sponsored or recommended results, not necessarily based on your preferences.
© Course Advisor – All Rights Reserved.