Mental & Social Health Services at San Bernardino Valley College
San Bernardino Valley College is located in San Bernardino, California and approximately 12,206 students attend the school each year.
Want to know more about the career opportunities in this field? Check out the Careers in Mental & Social Health Services section at the bottom of this page.
Featured San Bernardino Valley College Programs
Learn about start dates, transferring credits, availability of financial aid, and more by contacting the universities below.
BA in Psychology - Mental Health
Gain a strong foundation in the concepts involved with mental health therapy and assessment with this specialized online bachelor's from Southern New Hampshire University.

BS in Community Health Education
Focus on improving the health of individuals based on their lifestyle needs with this specialized online bachelor's from Southern New Hampshire University.
San Bernardino Valley College Mental & Social Health Services Degrees Available
- Basic Certificate in Mental Health Services (Less Than 1 Year)
- Undergrad Certificate in Mental Health Services (1 - 4 Years)
- Associate’s Degree in Mental Health Services
Featured San Bernardino Valley College Programs
Learn about start dates, transferring credits, availability of financial aid, and more by contacting the universities below.
BA in Psychology - Mental Health
Gain a strong foundation in the concepts involved with mental health therapy and assessment with this specialized online bachelor's from Southern New Hampshire University.
BS in Community Health Education
Focus on improving the health of individuals based on their lifestyle needs with this specialized online bachelor's from Southern New Hampshire University.
San Bernardino Valley College Mental & Social Health Services Rankings
Find San Bernardino Valley College Programs
BA in Sociology - Community Health
Become a force for the public good by exploring current trends in health and health policy from a national and global perspective with this specialized online bachelor's from Southern New Hampshire University.
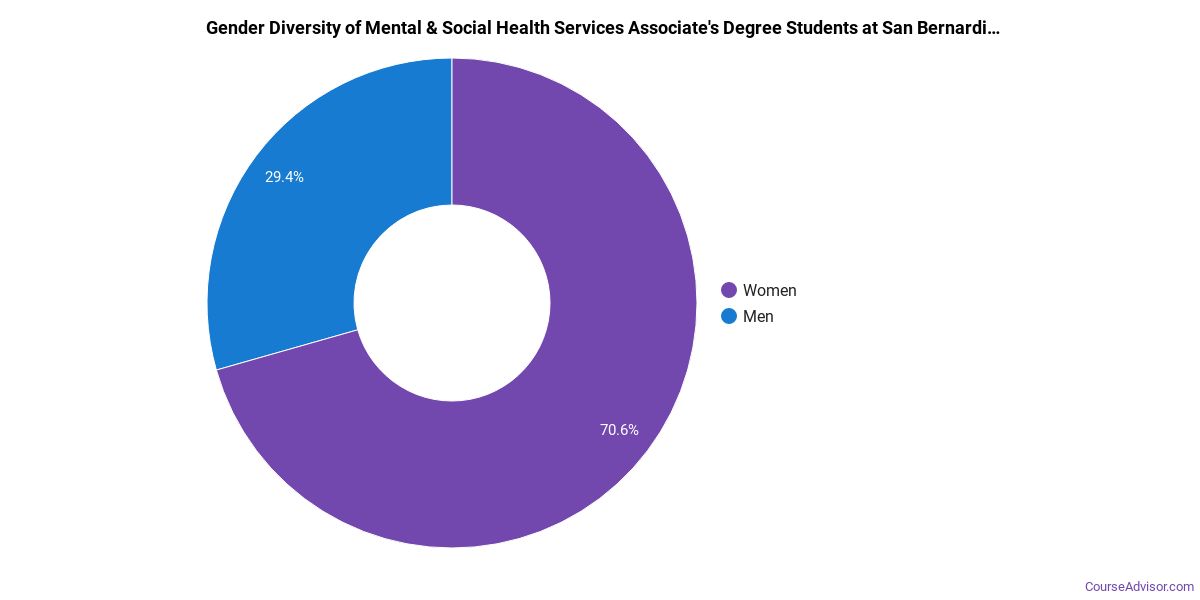
Mental Health Services Student Demographics at San Bernardino Valley College
Take a look at the following statistics related to the make-up of the mental health services majors at San Bernardino Valley College.
San Bernardino Valley College Mental & Social Health Services Associate’s Program
San Bernardino Valley College does a better job with serving racial-ethnic minorities than the typical school does. Its associate's program in mental health services graduates 59% more racial-ethnic minorities than the nationwide average.*
The following table and chart show the race/ethnicity for students who recently graduated from San Bernardino Valley College with a associate's in mental health services.
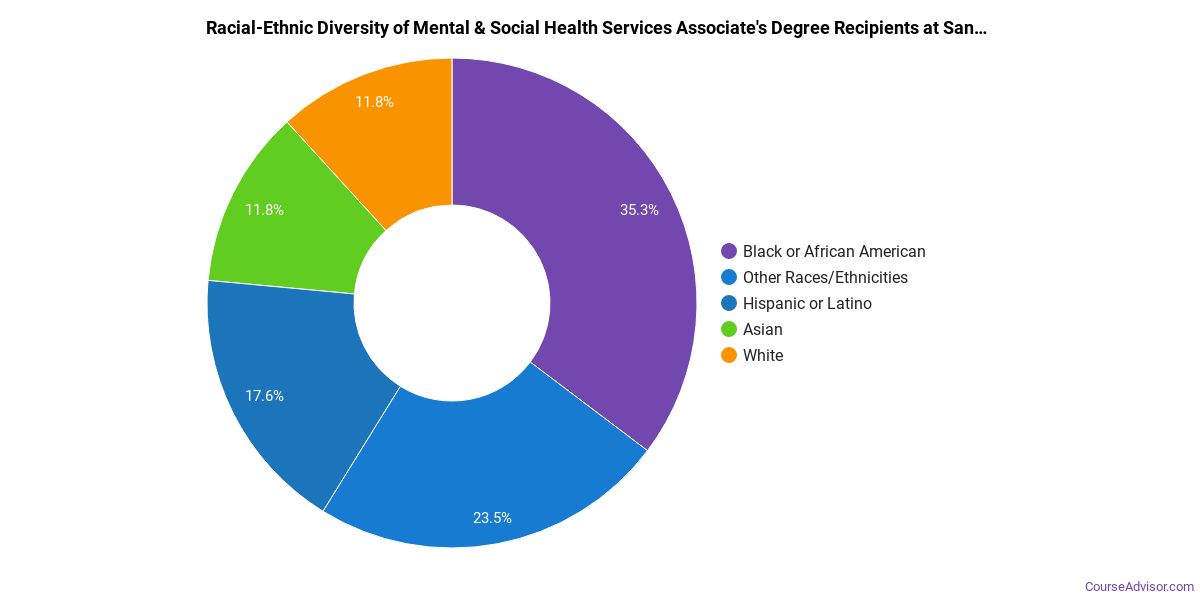
| Race/Ethnicity | Number of Students |
|---|---|
| Asian | 6 |
| Black or African American | 7 |
| Hispanic or Latino | 9 |
| White | 0 |
| International Students | 0 |
| Other Races/Ethnicities | 5 |
Concentrations Within Mental & Social Health Services
Mental & Social Health Services majors may want to concentrate their studies in one of these areas. The table shows all degrees awarded in this field awarded for all degree levels at San Bernardino Valley College. A concentration may not be available for your level.
| Concentration | Annual Degrees Awarded |
|---|---|
| Psychiatric/Mental Health Services Technician | 17 |
Related Majors
Careers That Mental Health Services Grads May Go Into
A degree in mental health services can lead to the following careers. Since job numbers and average salaries can vary by geographic location, we have only included the numbers for CA, the home state for San Bernardino Valley College.
| Occupation | Jobs in CA | Average Salary in CA |
|---|---|---|
| Marriage and Family Therapists | 21,920 | $51,950 |
| Healthcare Social Workers | 18,600 | $76,450 |
| Clinical, Counseling, and School Psychologists | 17,310 | $108,350 |
| Substance Abuse Social Workers | 14,840 | $61,640 |
| Psychiatric Technicians | 8,900 | $64,500 |
References
*The racial-ethnic minorities count is calculated by taking the total number of students and subtracting white students, international students, and students whose race/ethnicity was unknown. This number is then divided by the total number of students at the school to obtain the racial-ethnic minorities percentage.
More about our data sources and methodologies.
Course Advisor provides higher-education, college and university, degree, program, career, salary, and other helpful information to students, faculty, institutions, and other internet audiences. Presented information and data are subject to change. Inclusion on this website does not imply or represent a direct relationship with the company, school, or brand. Information, though believed correct at time of publication, may not be correct, and no warranty is provided. Contact the schools to verify any information before relying on it. Financial aid may be available for those who qualify. The displayed options may include sponsored or recommended results, not necessarily based on your preferences.
© Course Advisor – All Rights Reserved.