Samford University Science & Tech Programs
Samford University is a private not-for-profit institution located in Birmingham, AL. The Suburbs Of A Large City provides tranquility and safety close to urban amenities.
Featured schools near , edit
Samford University Rankings
Samford University has earned the following rankings for science & tech programs at the bachelors level:
| Ranking | Rank | Among |
|---|---|---|
| Overall Quality | #4 of 60 | State — Alabama |
| Overall Quality | #50 of 1,106 | Region — Southeast |
| Overall Quality | #384 of 4,630 | Nationwide |
Where Is Samford University?
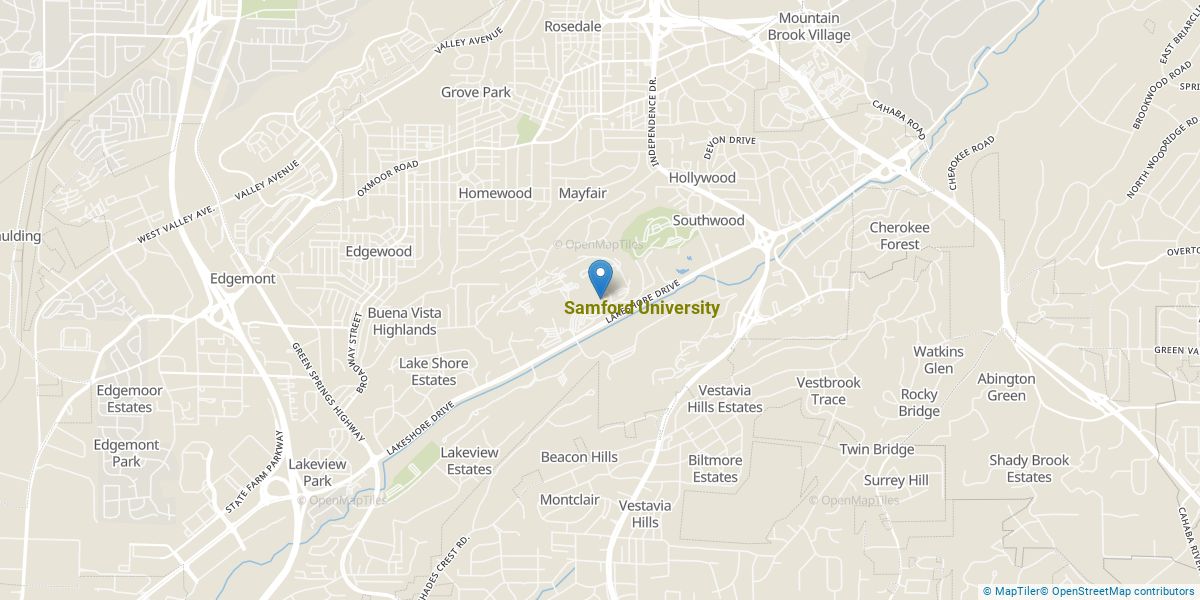
Contact details for Samford University can be found below.
| Contact Details | |
|---|---|
| Address: | 800 Lakeshore Drive, Birmingham, AL 35229-2240 |
| Phone: | 2057262011 |
| Website: | www.samford.edu/ |
| Admissions: | www.samford.edu/admission |
| Financial Aid: | www.samford.edu/departments/financial-services/ |
How Do I Get Into Samford University?
You can apply to Samford University online at: www.samford.edu/admission/apply
Samford University is classified as Less Selective (70-85%) for admissions.
Admission Requirements for Samford University
These are the things Samford University looks for in applicants:
| Requirement | Status |
|---|---|
| Secondary School Record | Required |
| Secondary School GPA | Required |
| Recommendations | Required |
| Admission Test Scores (SAT/ACT) | Considered but not required |
How Hard Is It To Get Into Samford University?
Samford University admits 82%, making it highly accessible. Ensure you meet all application requirements and prepare the application in full.
Of those admitted, 29% choose to enroll — a typical enrollment-to-admission yield.
Average Test Scores
25% of admitted students submitted SAT scores and 66% submitted ACT scores.
When looking at the 25th through the 75th percentile of admitted students at Samford University, SAT Evidence-Based Reading and Writing scores ranged between 550 and 640. Math scores were between 520 and 610.
Selectivity by Gender
Acceptance rates at Samford University are broken out by gender below.
| Gender | Applicants | Admitted | Acceptance Rate |
|---|---|---|---|
| Men | 1,596 | 1,256 | 79% |
| Women | 2,963 | 2,499 | 84% |
Can I Afford Samford University?
The average net price after aid at Samford University is $30,795. Your actual cost will depend on your family’s circumstances since net price varies by income group.
Tuition & Fees
| Category | Cost |
|---|---|
| In-State Tuition | $39,000 |
| In-State Fees | $1,150 |
| Out-of-State Tuition | $39,000 |
| Out-of-State Fees | $1,150 |
| Total In-State Tuition & Fees | $40,150 |
| Total Out-of-State Tuition & Fees | $40,150 |
Financial Aid
When including loans, work-study, and grants, 28% of students at Samford University receive some form of financial aid (1,080 students).
About 99% of students at Samford University receive grant or scholarship aid, averaging $22,680 per student.
11% of students receive federal Pell Grants, averaging $5,769.
Student Loan Debt
27% of Samford University undergraduates take out federal student loans, averaging $6,374 per year.
Samford University Undergraduate Student Diversity
There are 2,271 students enrolled at Samford University. Samford University is classified as a 5,000 - 9,999 institution by enrollment size. Its Carnegie Classification is Doctoral/Professional Universities.
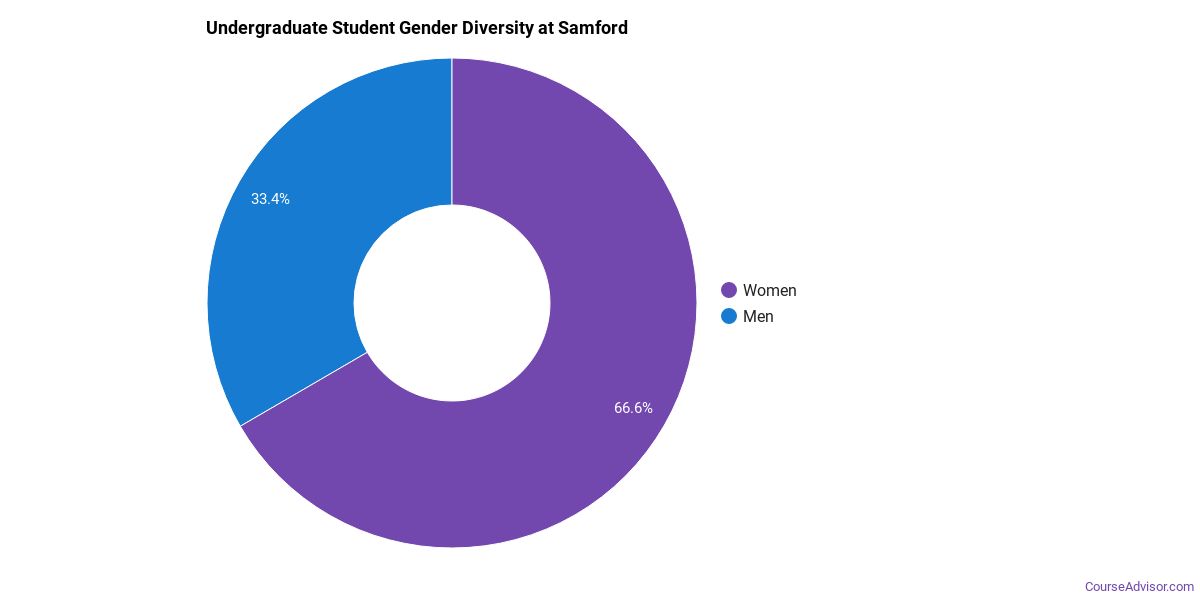
Gender Diversity
Of the 3,828 undergraduate students at Samford University, approximately 35% are male and 65% are female.
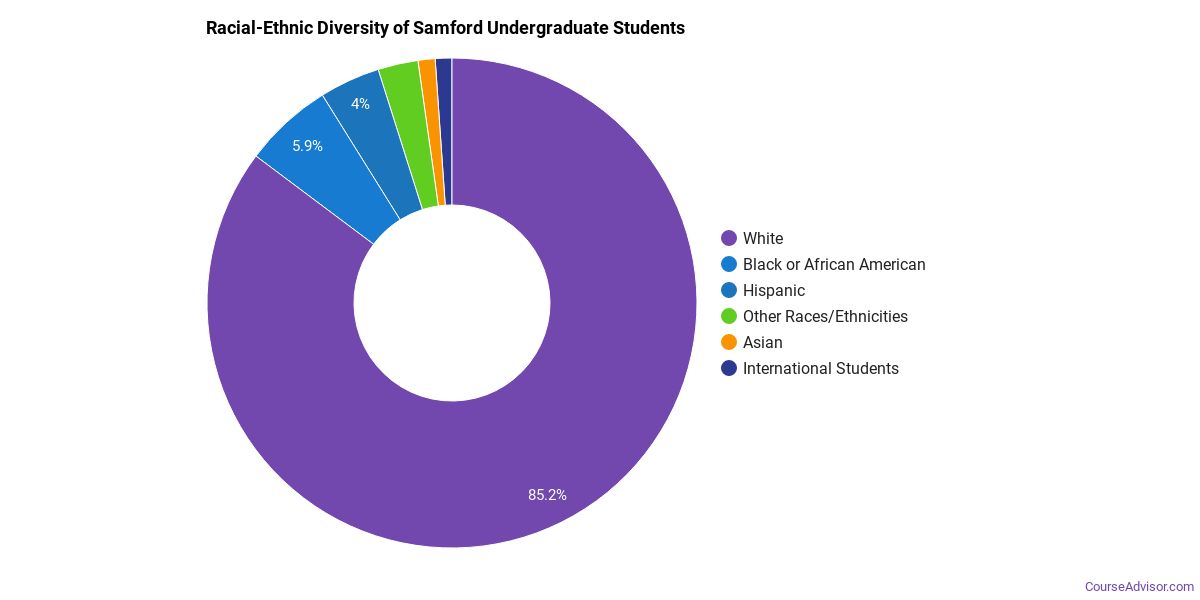
Racial-Ethnic Diversity
The racial-ethnic breakdown of Samford University undergraduate students is as follows.
| Race/Ethnicity | Number of Students |
|---|---|
| Asian | 49 |
| Black or African American | 183 |
| Hispanic | 187 |
| White | 3,230 |
| American Indian/Alaska Native | 11 |
| Native Hawaiian/Pacific Islander | 3 |
| Two or More Races | 84 |
| Non-Resident | 42 |
Geographic Diversity
The top 5 home states of first-time undergraduate students at Samford University are shown below.

| State | First-Time UG Students |
|---|---|
| Alabama | 248 |
| Georgia | 228 |
| Tennessee | 215 |
| Texas | 90 |
| Florida | 77 |
Additionally, approximately 1.1% of undergraduate students are non-resident from outside the United States.
Samford University Graduate Student Diversity
1,959 of Samford University’s students are in graduate programs. The highest graduate-level award offered is Doctor’s degree.
Gender Diversity (Graduate)
Among graduate students at Samford University, approximately 31% are male and 69% are female.

Racial-Ethnic Diversity (Graduate)
The racial-ethnic breakdown of Samford University graduate students is as follows.

| Race/Ethnicity | Number of Students |
|---|---|
| Asian | 47 |
| Black or African American | 286 |
| Hispanic | 101 |
| White | 1,377 |
| American Indian/Alaska Native | 9 |
| Native Hawaiian/Pacific Islander | 1 |
| Two or More Races | 23 |
| Non-Resident | 27 |
Online Learning at Samford University
Samford University provides online programs for students who need flexibility.
608 undergraduate students at Samford University took at least one online class — of those, 46 took all of their classes online.
At the graduate level, 284 students took at least one online class and 366 took all classes online. Distance education is available at the undergraduate and graduate levels.
Academic Programs at Samford University
Samford University offers 24 distinct academic programs.
The highest level of award offered is Doctor’s degree.
Institutional Profile
Samford University has an open admission policy: No. Credit transfer:
- AP credits: Implied no
- Dual enrollment credits: Yes
- Life experience credits: Implied no
References
More about our data sources and methodologies.
Course Advisor provides higher-education, college and university, degree, program, career, salary, and other helpful information to students, faculty, institutions, and other internet audiences. Presented information and data are subject to change. Inclusion on this website does not imply or represent a direct relationship with the company, school, or brand. Information, though believed correct at time of publication, may not be correct, and no warranty is provided. Contact the schools to verify any information before relying on it. Financial aid may be available for those who qualify. The displayed options may include sponsored or recommended results, not necessarily based on your preferences.
© Course Advisor – All Rights Reserved.