Mathematics at Saint Louis University
What traits are you looking for in a school for Mathematics, take a look at what Saint Louis University. We’ve gathered the following information to help you decide.
Saint Louis University is in Saint Louis, MO.
For the most recent IPEDS reporting year, 22 mathematics degrees were awarded at Saint Louis University.
Featured schools near , edit
Studying Online at Saint Louis University
Online coursework is an option at Saint Louis University. Of 17,059 students, 1,143 (7%) studied exclusively online and 2,559 (15%) took at least some classes online.
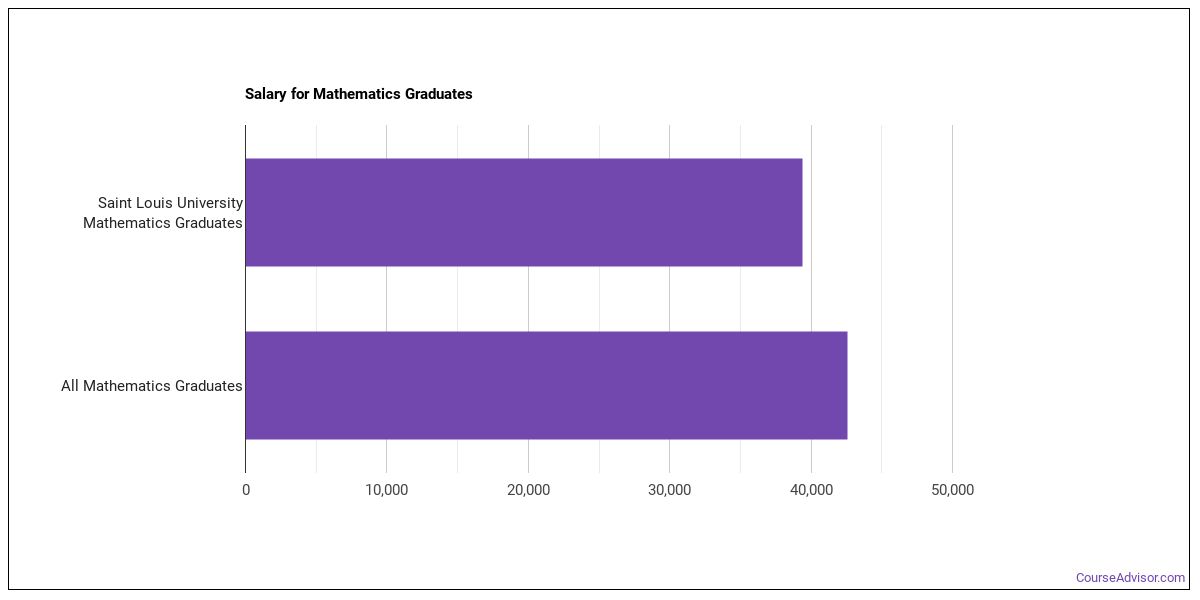
Earnings for Mathematics Graduates from Saint Louis University
Those who finish Saint Louis University’s Mathematics program earn the following amounts (per the U.S. Department of Education’s College Scorecard):
| Years After Graduation | Median Earnings |
|---|---|
| 2 years | $42,682 |
| 3 years | $46,814 |
| 4 years | $55,280 |
| 5 years | $75,468 |
How do these earnings stack up against the rest of the school? Four years after graduating, Mathematics graduates from Saint Louis University earn a median of $55,280, compared with $74,905 for all Saint Louis University graduates — about 26% lower than the school-wide median.

Student Demographics & Diversity
Below you’ll find the diversity of Mathematics graduates at Saint Louis University, broken down by degree level.
Across all degree levels, Mathematics graduates at Saint Louis University are 59% women (13) and 41% men (9).
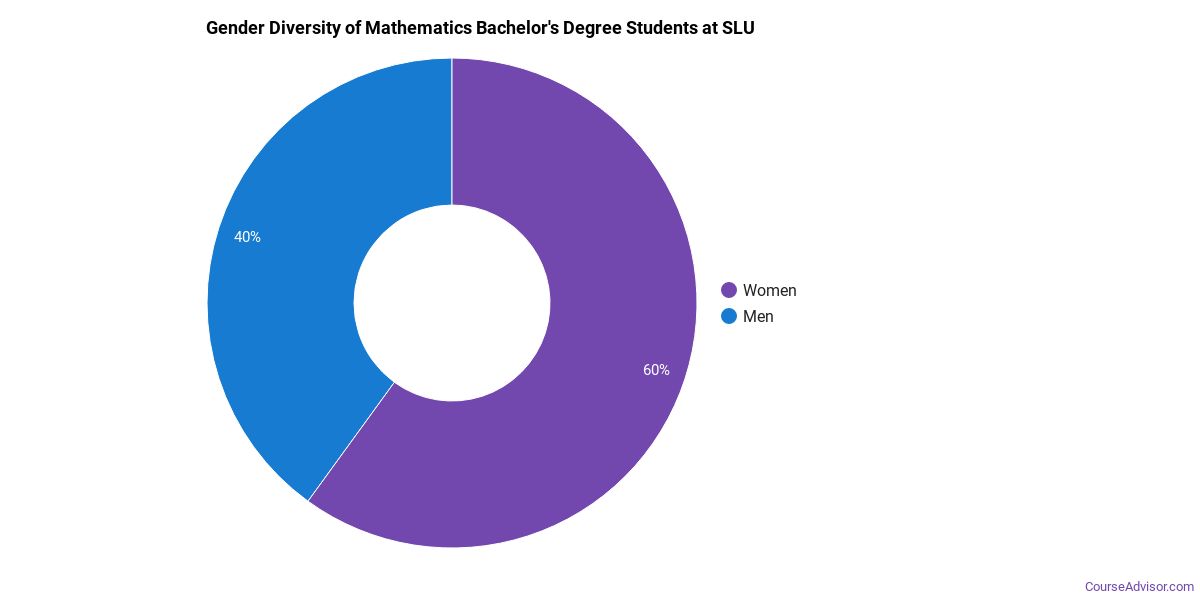
Mathematics Bachelor’s Program at Saint Louis University
Of the 17 bachelor’s mathematics graduates at Saint Louis University, 59% were women (10) and 41% were men (7).
The following table and chart show the race/ethnicity of Mathematics bachelor’s degree recipients at Saint Louis University.
| Race / Ethnicity | Number of Graduates |
|---|---|
| White | 12 |
| Hispanic / Latino | 1 |
| Asian | 3 |
| International (Nonresident) | 1 |
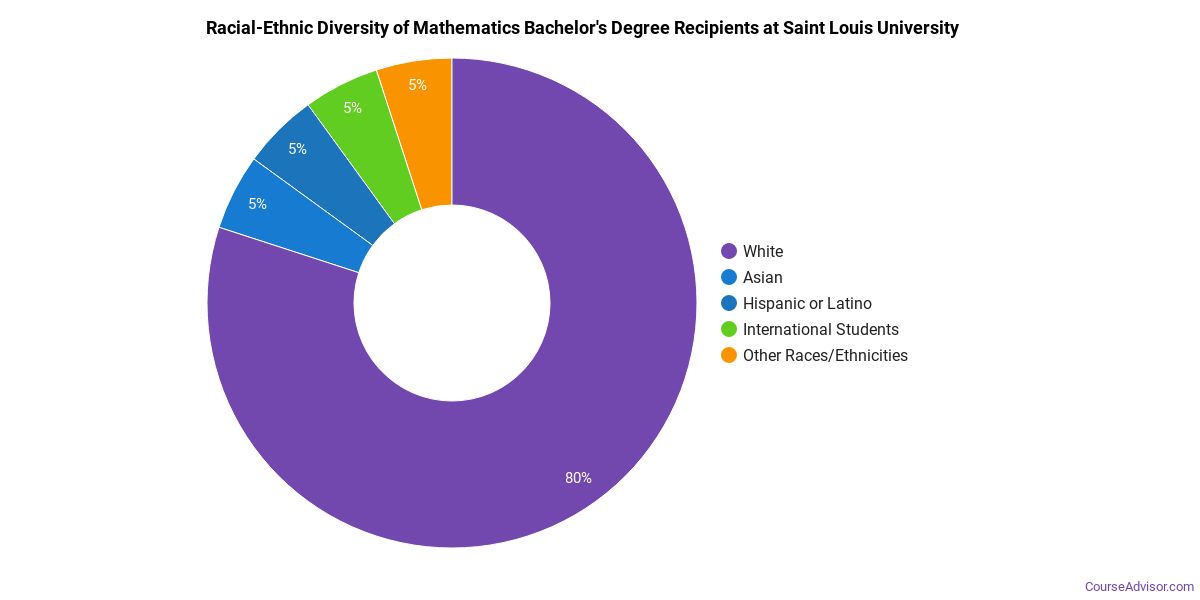
Minority students account for 24% of Mathematics bachelor’s degree recipients at Saint Louis University, lower than the national average of 33%.*
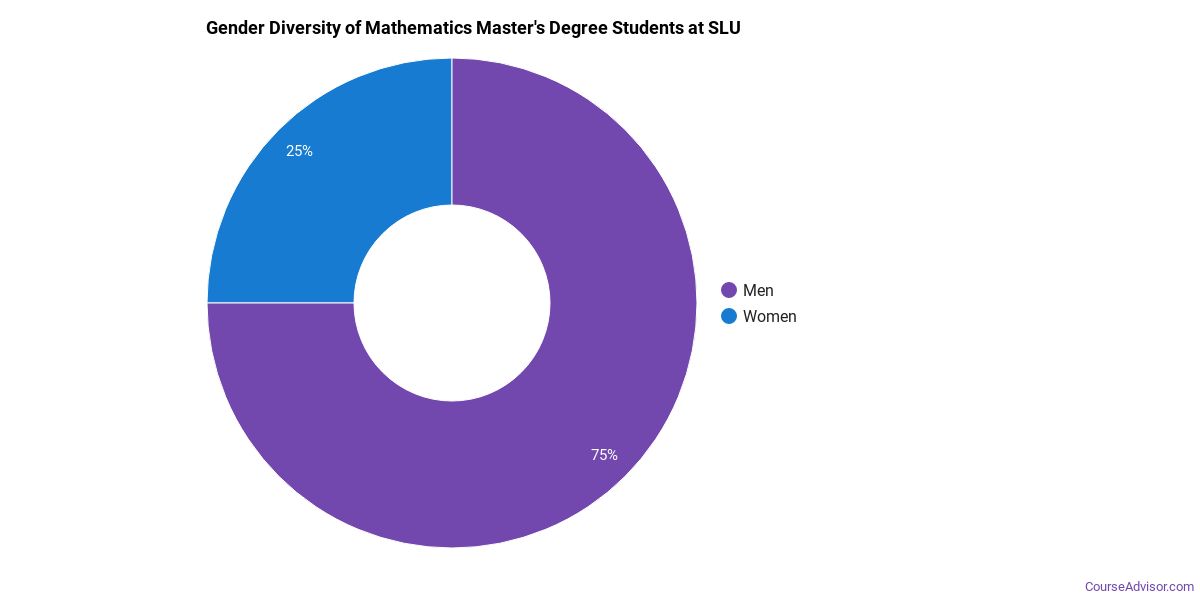
Mathematics Master’s Program at Saint Louis University
Of the 3 master’s mathematics graduates at Saint Louis University, 100% were women (3) and 0% were men (0).
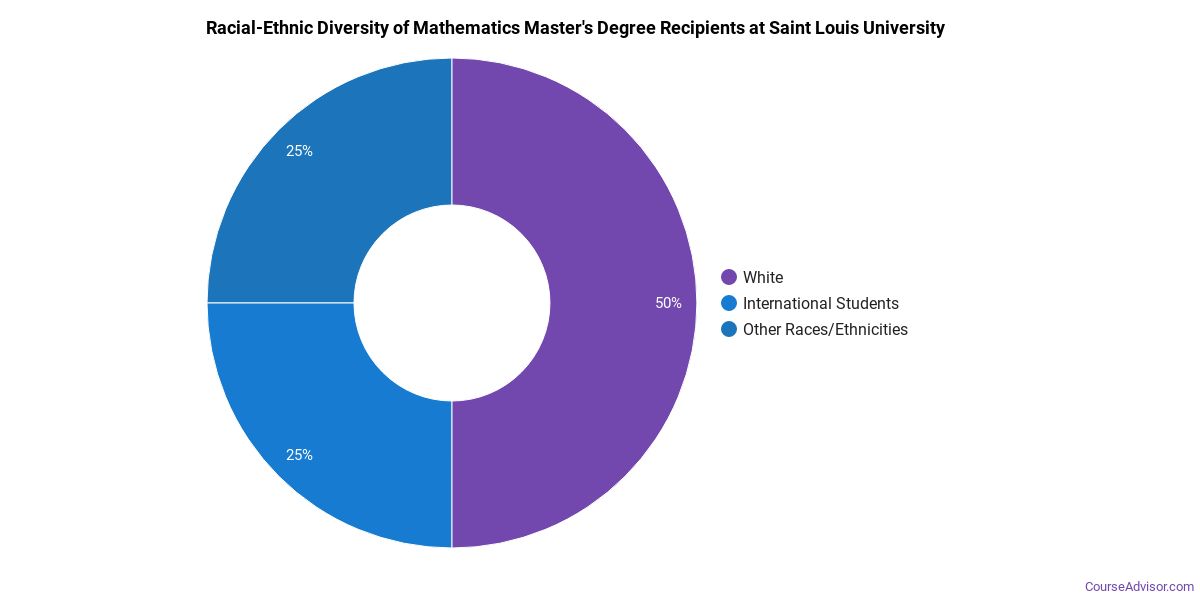
The following table and chart show the race/ethnicity of Mathematics master’s degree recipients at Saint Louis University.
| Race / Ethnicity | Number of Graduates |
|---|---|
| White | 2 |
| International (Nonresident) | 1 |
Mathematics Doctoral Program at Saint Louis University
Of the 2 doctoral mathematics graduates at Saint Louis University, 0% were women (0) and 100% were men (2).

The following table and chart show the race/ethnicity of Mathematics doctoral degree recipients at Saint Louis University.
| Race / Ethnicity | Number of Graduates |
|---|---|
| White | 1 |
| International (Nonresident) | 1 |

*The racial-ethnic minorities figure is the total number of graduates minus White, international (nonresident), and unknown-race graduates.
More Specific Mathematics Concentrations at Saint Louis University
The Mathematics program at Saint Louis University breaks down into more specific concentrations:
| Concentration | Graduates |
|---|---|
| General Mathematics | 22 |
Top-Paying Careers for Mathematics Graduates
Graduates of the Mathematics program at Saint Louis University pursue many career paths. Here are the best-paid careers for Mathematics graduates, ordered by median annual salary:
| Occupation | Nationwide Median Wage |
|---|---|
| Water Resource Specialists | $179,716 |
| Business Intelligence Analysts | $143,840 |
| Natural Sciences Managers | $132,227 |
| Statisticians | $130,349 |
| Bioinformatics Technicians | $121,896 |
| Biostatisticians | $121,594 |
| Clinical Research Coordinators | $110,931 |
| Data Scientists | $106,295 |
| Clinical Data Managers | $99,475 |
| Secondary School Teachers, Except Special and Career/Technical Education | $77,927 |
References
- IPEDS — Integrated Postsecondary Education Data System
- U.S. Department of Education — College Scorecard
- O*NET Online (Bureau of Labor Statistics)
- National Center for Education Statistics
More about our data sources and methodologies.
Course Advisor provides higher-education, college and university, degree, program, career, salary, and other helpful information to students, faculty, institutions, and other internet audiences. Presented information and data are subject to change. Inclusion on this website does not imply or represent a direct relationship with the company, school, or brand. Information, though believed correct at time of publication, may not be correct, and no warranty is provided. Contact the schools to verify any information before relying on it. Financial aid may be available for those who qualify. The displayed options may include sponsored or recommended results, not necessarily based on your preferences.
© Course Advisor – All Rights Reserved.