Ethnic Studies at Rutgers University-New Brunswick
If you plan to study Ethnic Studies, take a look at what Rutgers University-New Brunswick. Get started with the following essential facts.
Rutgers University-New Brunswick is located in New Brunswick, NJ.
In the most recent year for which we have data, 19 ethnic studies degrees were granted at Rutgers University-New Brunswick.
Featured schools near , edit
Online Class Availability at Rutgers University-New Brunswick
Many students take online classes at Rutgers University-New Brunswick. Among 52,269 students, 3,953 (8%) were enrolled entirely in distance education and 21,737 (42%) took at least some classes online.
Ethnic Studies Rankings at Rutgers University-New Brunswick
These rankings give you a sense of how Rutgers University-New Brunswick’s Ethnic Studies program against peer institutions.
Bachelor’s-Level Rankings
| Ranking | Scope | Rank |
|---|---|---|
| Best Schools (Quality) | New Jersey | #3 of 3 |
| Best Value | New Jersey | #3 of 3 |
| Best Value | Middle Atlantic (Region) | #16 of 23 |
| Best Schools (Quality) | Middle Atlantic (Region) | #17 of 24 |
| Best Schools (Quality) | Nationwide | #104 of 143 |
| Best Value | Nationwide | #123 of 142 |
Master’s-Level Rankings
| Ranking | Scope | Rank |
|---|---|---|
| Best Schools (Quality) | New Jersey | #3 of 3 |
| Best Value | New Jersey | #3 of 3 |
| Best Value | Middle Atlantic (Region) | #16 of 23 |
| Best Schools (Quality) | Middle Atlantic (Region) | #17 of 24 |
| Best Schools (Quality) | Nationwide | #104 of 143 |
| Best Value | Nationwide | #123 of 142 |
Doctoral-Level Rankings
| Ranking | Scope | Rank |
|---|---|---|
| Best Schools (Quality) | New Jersey | #3 of 3 |
| Best Value | New Jersey | #3 of 3 |
| Best Value | Middle Atlantic (Region) | #16 of 23 |
| Best Schools (Quality) | Middle Atlantic (Region) | #17 of 24 |
| Best Schools (Quality) | Nationwide | #104 of 143 |
| Best Value | Nationwide | #123 of 142 |
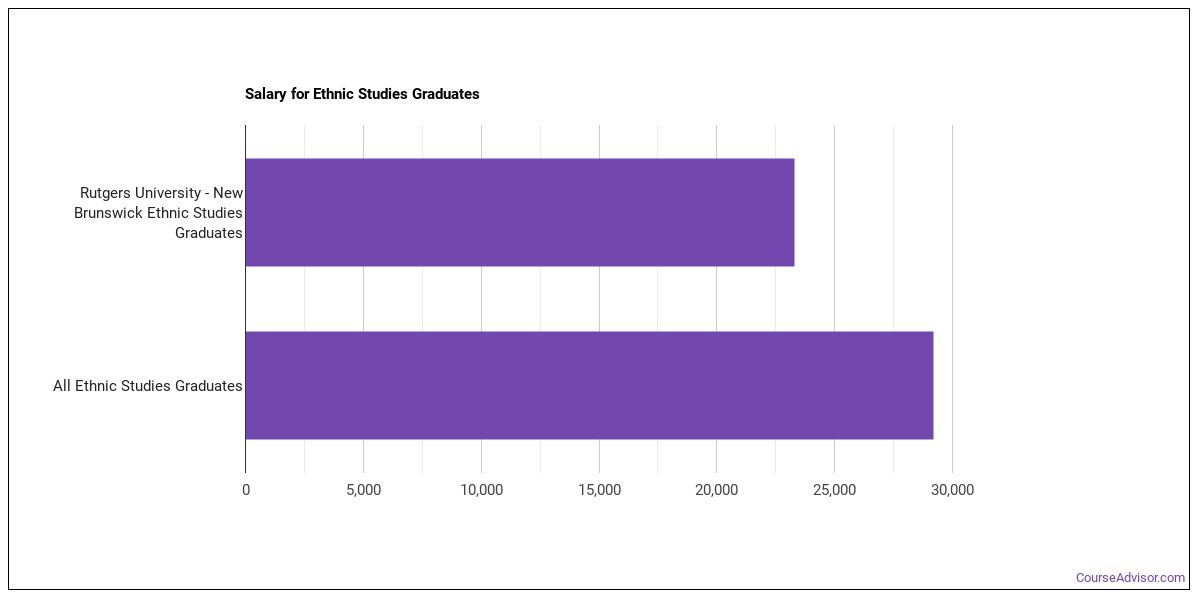
Earnings for Ethnic Studies Graduates from Rutgers University-New Brunswick
Students who complete Rutgers University-New Brunswick’s Ethnic Studies program earn at the following median levels (per the U.S. Department of Education’s College Scorecard):
| Years After Graduation | Median Earnings |
|---|---|
| 1 year | $23,314 |
| 2 years | $20,140 |
| 3 years | $39,265 |
| 4 years | $54,339 |
| 5 years | $34,770 |
Is this above or below average for the school? Four years after graduating, Ethnic Studies graduates from Rutgers University-New Brunswick take home a median $54,339, compared with $78,171 for all Rutgers University-New Brunswick graduates — about 30% lower than the school-wide median.

Median Debt at Graduation
The median debt for Ethnic Studies graduates from Rutgers University-New Brunswick is $26,900.
Student Demographics & Diversity
The following sections describe the diversity of Ethnic Studies graduates at Rutgers University-New Brunswick, broken down by degree level.
Program-wide, Ethnic Studies graduates at Rutgers University-New Brunswick are 79% women (15) and 21% men (4).
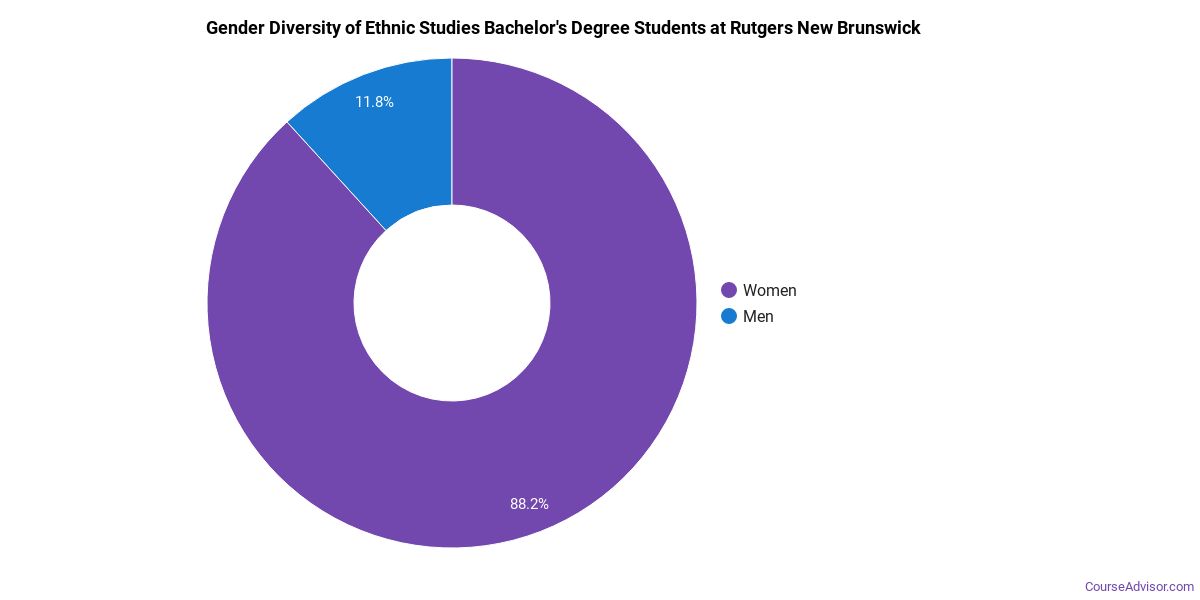
Ethnic Studies Bachelor’s Program at Rutgers University-New Brunswick
Among the 11 bachelor’s ethnic studies degrees awarded at Rutgers University-New Brunswick, 64% were women (7) and 36% were men (4).
The following table and chart show the race/ethnicity of Ethnic Studies bachelor’s degree recipients at Rutgers University-New Brunswick.
| Race / Ethnicity | Number of Graduates |
|---|---|
| White | 3 |
| Hispanic / Latino | 5 |
| Black / African American | 3 |
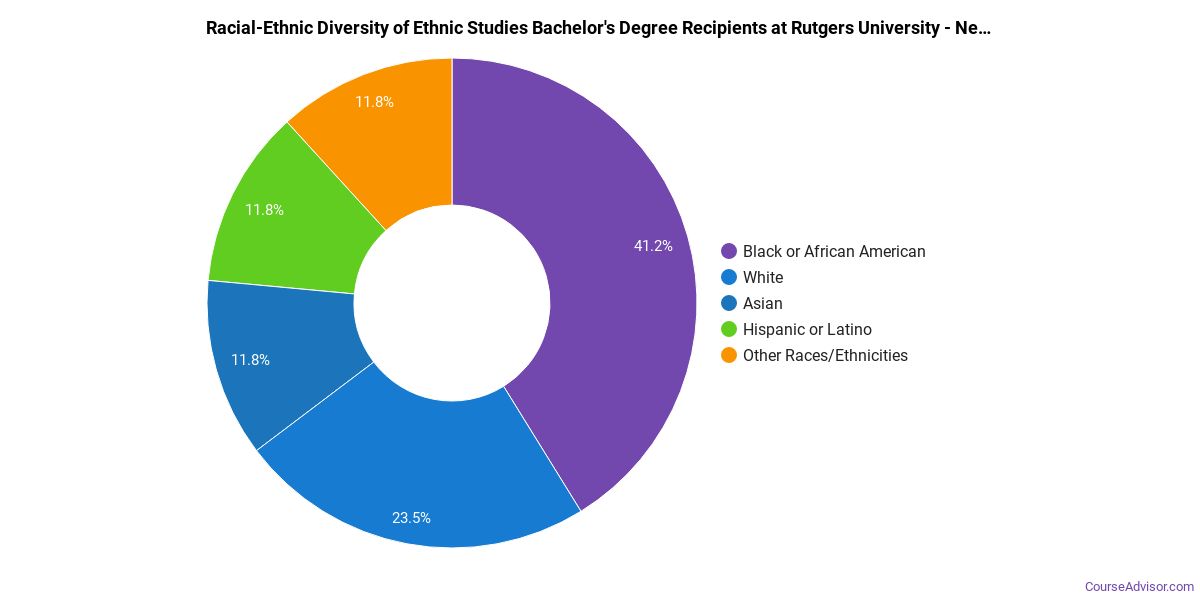
Racial-ethnic minorities make up 73% of Ethnic Studies bachelor’s degree recipients at Rutgers University-New Brunswick, above the national average of 66%.*
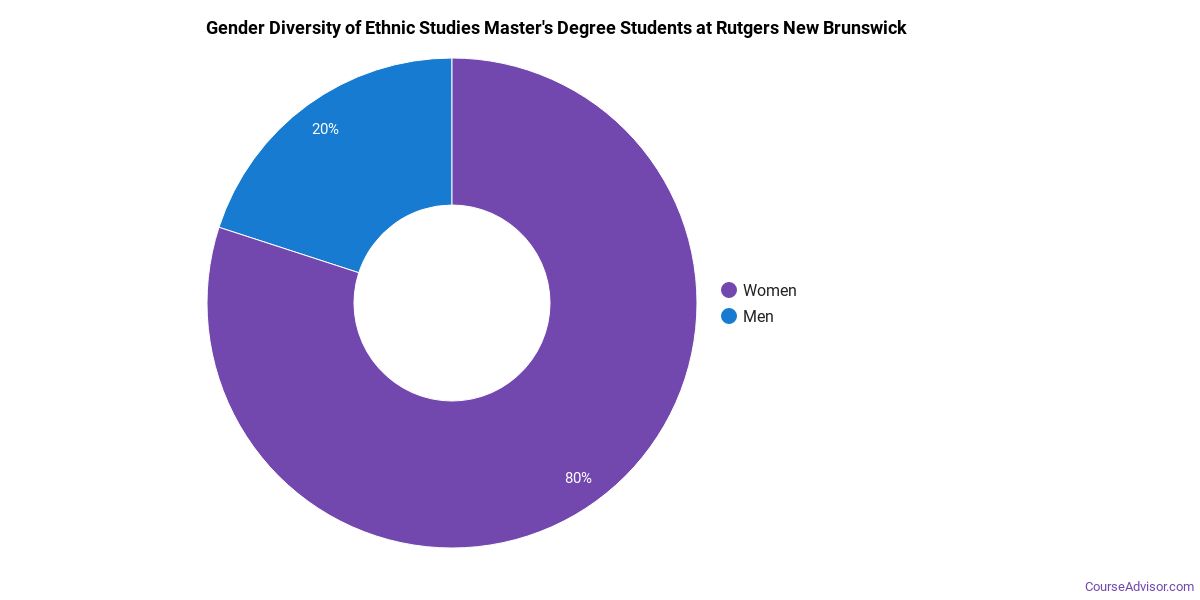
Ethnic Studies Master’s Program at Rutgers University-New Brunswick
Among the 7 master’s ethnic studies graduates at Rutgers University-New Brunswick, 100% were women (7) and 0% were men (0).
The following table and chart show the race/ethnicity of Ethnic Studies master’s degree recipients at Rutgers University-New Brunswick.
| Race / Ethnicity | Number of Graduates |
|---|---|
| White | 4 |
| Hispanic / Latino | 1 |
| International (Nonresident) | 2 |
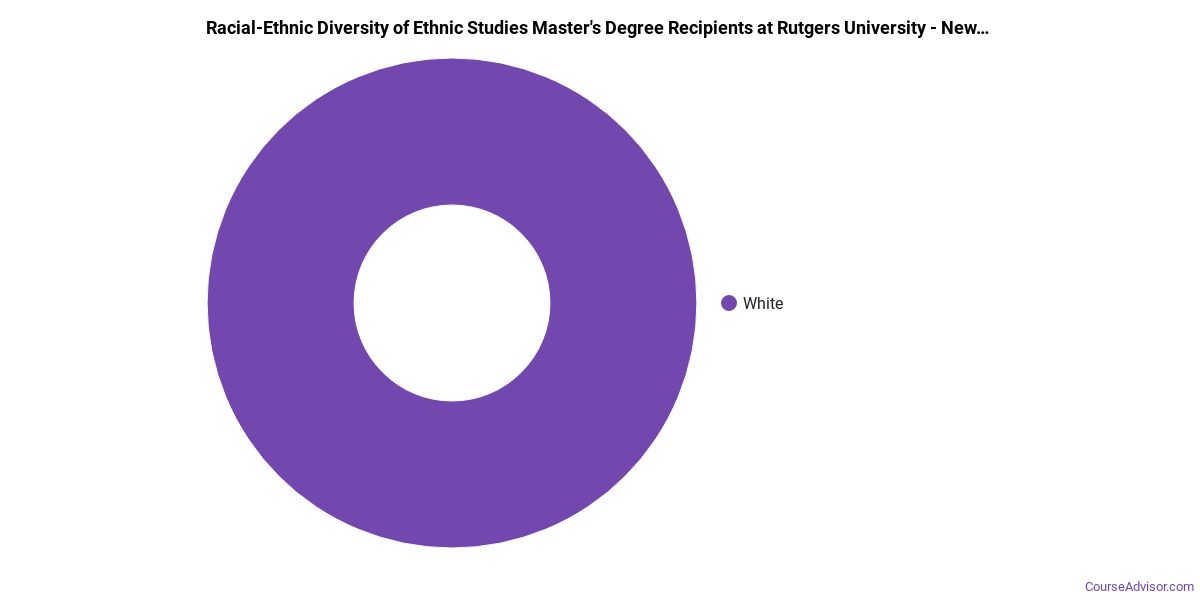
Minority students account for 14% of Ethnic Studies master’s degree recipients at Rutgers University-New Brunswick, below the national average of 60%.*
Ethnic Studies Doctoral Program at Rutgers University-New Brunswick
Among the 1 doctoral ethnic studies graduates at Rutgers University-New Brunswick, 100% were women (1) and 0% were men (0).

The following table and chart show the race/ethnicity of Ethnic Studies doctoral degree recipients at Rutgers University-New Brunswick.
| Race / Ethnicity | Number of Graduates |
|---|---|
| White | 1 |

*The racial-ethnic minorities figure is the total number of graduates minus White, international (nonresident), and unknown-race graduates.
More Specific Ethnic Studies Concentrations at Rutgers University-New Brunswick
This Ethnic Studies program at Rutgers University-New Brunswick includes the following sub-specializations:
| Concentration | Graduates |
|---|---|
| African American Studies | 4 |
| Latino Studies | 3 |
| Women’s Studies | 12 |
Best-Paid Careers for Ethnic Studies Graduates
Students who finish Ethnic Studies program at Rutgers University-New Brunswick go on to a range of careers. Below are the highest-paying careers for Ethnic Studies majors, ordered by median annual salary:
| Occupation | Nationwide Median Wage |
|---|---|
| Interpreters and Translators | $52,627 |
| Area, Ethnic, and Cultural Studies Teachers, Postsecondary | $47,517 |
References
- IPEDS — Integrated Postsecondary Education Data System
- U.S. Department of Education — College Scorecard
- O*NET Online (Bureau of Labor Statistics)
- National Center for Education Statistics
More about our data sources and methodologies.
Course Advisor provides higher-education, college and university, degree, program, career, salary, and other helpful information to students, faculty, institutions, and other internet audiences. Presented information and data are subject to change. Inclusion on this website does not imply or represent a direct relationship with the company, school, or brand. Information, though believed correct at time of publication, may not be correct, and no warranty is provided. Contact the schools to verify any information before relying on it. Financial aid may be available for those who qualify. The displayed options may include sponsored or recommended results, not necessarily based on your preferences.
© Course Advisor – All Rights Reserved.