Rose - Hulman Institute of Technology Overview
Rose - Hulman Institute of Technology is a private not-for-profit institution located in Terre Haute, Indiana. The city atmosphere of Terre Haute makes it a great place for students who enjoy having lots of educational and entertainment options.
What Is Rose - Hulman Institute of Technology Known For?
- The highest award offered at Rose - Hulman Institute of Technology is the master's degree.
- During a recent academic cycle, 95% of the faculty were full-time.
- After graduation, Rose - Hulman Institute of Technology bachelor's degree recipients go on to jobs where they make $101,253 a year. That's about 148% more than their peers at other schools.
- It takes the average Rose - Hulman Institute of Technology student 4.1 years to graduate. This is pretty good when compared to the national rate of 4.4 years.
Where Is Rose - Hulman Institute of Technology?

Contact details for Rose - Hulman Institute of Technology are given below.
| Contact Details | |
|---|---|
| Address: | 5500 Wabash Avenue, Terre Haute, IN 47803-3920 |
| Phone: | 812-877-1511 |
| Website: | www.rose-hulman.edu |
How Do I Get Into Rose - Hulman Institute of Technology?
You can apply to Rose - Hulman Institute of Technology online at: https://www.rose-hulman.edu/admissions-and-aid/the-application-process/application-and-deadlines/index.html
Admission Requirements for Rose - Hulman Institute of Technology
| Submission | Required? |
|---|---|
| High School GPA | 5 |
| High School Rank | 5 |
| High School Transcript | 1 |
| College Prep Program | 1 |
| Recommendations | 1 |
| SAT or ACT Scores | 5 |
| TOEFL | 1 |
How Hard Is It To Get Into Rose - Hulman Institute of Technology?
Approximately 76% of accepted students are men and 24% are women. The acceptance rate for men is 71%, and the acceptance rate for women is 79%.
Average Test Scores
About 42% of students accepted to Rose - Hulman Institute of Technology submitted their SAT scores. When looking at the 25th through the 75th percentile, SAT Evidence-Based Reading and Writing scores ranged between 620 and 720. Math scores were between 670 and 763.
Can I Afford Rose - Hulman Institute of Technology?
The net price is calculated by adding tuition, room, board and other costs and subtracting financial aid.
Student Loan Debt
While almost two-thirds of students nationwide take out loans to pay for college, the percentage may be quite different for the school you plan on attending. At Rose - Hulman Institute of Technology, approximately 47% of students took out student loans averaging $12,038 a year. That adds up to $48,152 over four years for those students.
Explore Best Ranked Schools for You
Rose - Hulman Institute of Technology Undergraduate Student Diversity
There are also 18 graduate students at the school.
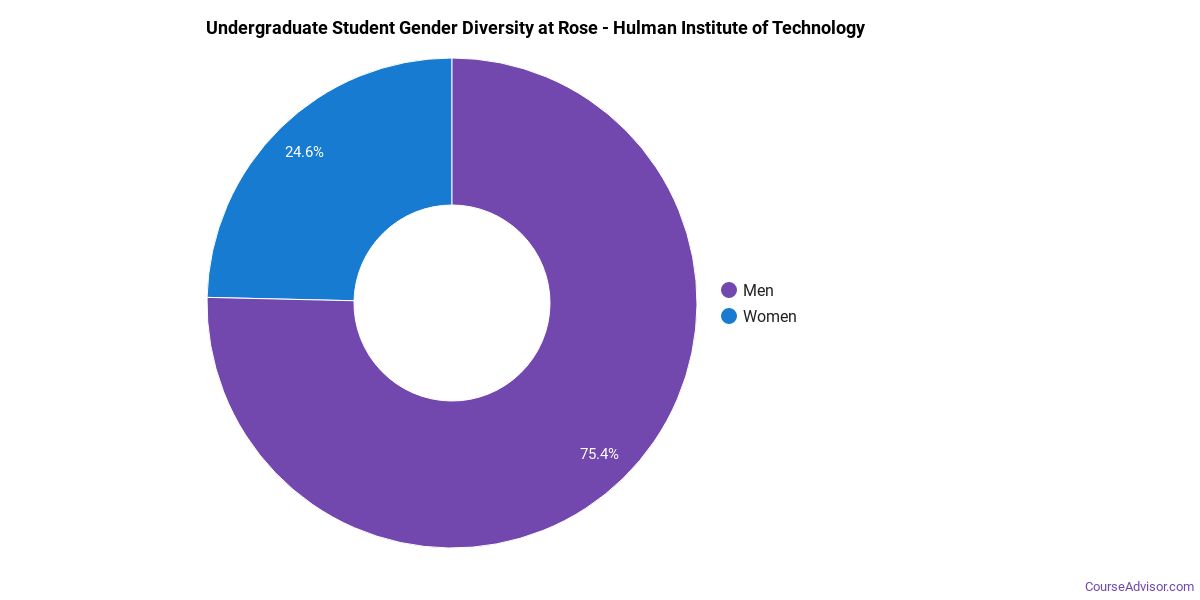
Gender Diversity
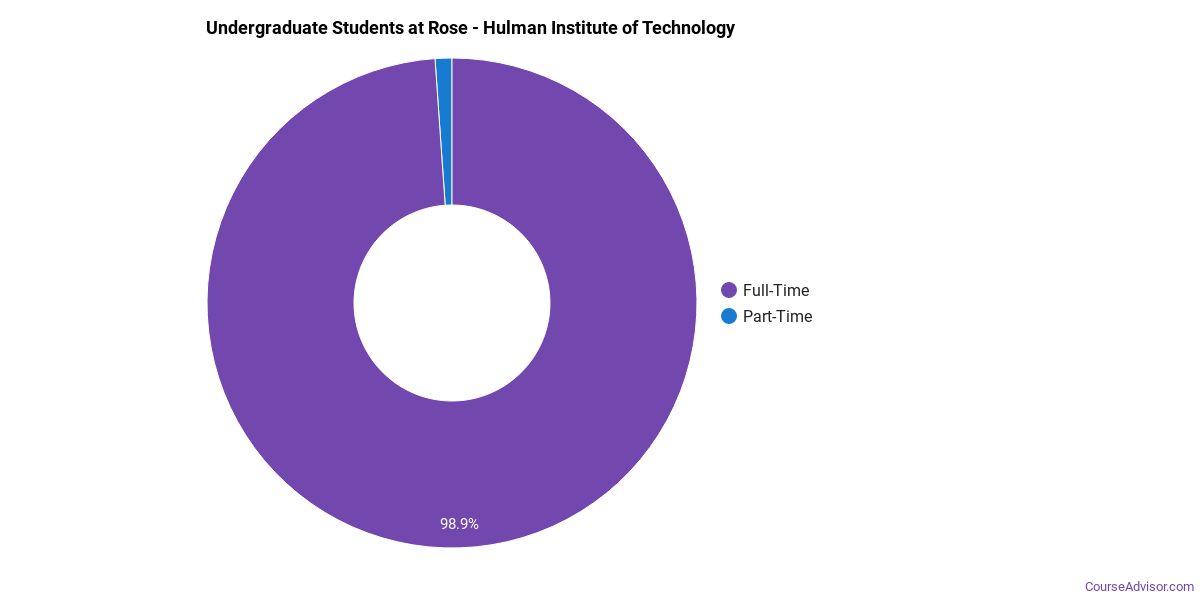
Of the 1,952 full-time undergraduates at Rose - Hulman Institute of Technology, 76% are male and 24% are female.
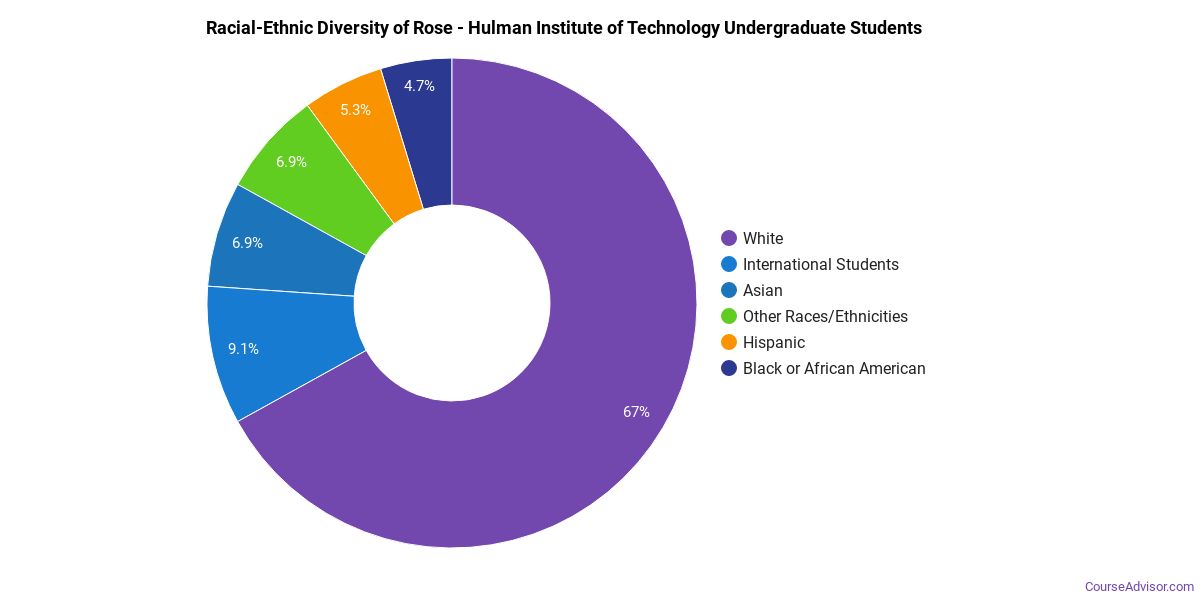
Racial-Ethnic Diversity
The racial-ethnic breakdown of Rose - Hulman Institute of Technology students is as follows.
| Race/Ethnicity | Number of Grads |
|---|---|
| Asian | 122 |
| Black or African American | 92 |
| Hispanic or Latino | 104 |
| White | 1,288 |
| International Students | 223 |
| Other Races/Ethnicities | 123 |
Geographic Diversity
Indiana students aren't the only ones who study at Rose - Hulman Institute of Technology. At this time, 33 states are represented by the student population at the school.
Over 19 countries are represented at Rose - Hulman Institute of Technology. The most popular countries sending students to the school are China, India, and South Korea.
Rose - Hulman Institute of Technology Undergraduate Concentrations
The table below shows the number of awards for each concentration.
| Major | Bachelor’s | Master’s | TOTAL |
|---|---|---|---|
| Mechanical Engineering | 121 | 3 | 124 |
| Computer Science | 63 | 0 | 63 |
| Computer Engineering | 63 | 0 | 63 |
| Electrical Engineering | 35 | 4 | 39 |
| Chemical Engineering | 27 | 2 | 29 |
| Biomedical Engineering | 28 | 0 | 28 |
| Civil Engineering | 20 | 4 | 24 |
| Engineering-Related Fields | 0 | 11 | 11 |
| General Engineering | 11 | 0 | 11 |
| Mathematics | 10 | 0 | 10 |
| Biochemistry, Biophysics & Molecular Biology | 8 | 0 | 8 |
| Data Science | 5 | 0 | 5 |
| Chemistry | 5 | 0 | 5 |
| General Biology | 4 | 0 | 4 |
| Computer Information Systems | 4 | 0 | 4 |
| Physics | 4 | 0 | 4 |
| Engineering Physics | 3 | 0 | 3 |
| Economics | 1 | 0 | 1 |
| Biomathematics & Bioinformatics | 0 | 0 | 0 |
| Environmental Engineering | 0 | 0 | 0 |
| Systems Engineering | 0 | 0 | 0 |
| Computational Science | 0 | 0 | 0 |
| International Studies | 0 | 0 | 0 |
| TOTAL | 412 | 24 | 436 |
References
*The racial-ethnic minorities count is calculated by taking the total number of students and subtracting white students, international students, and students whose race/ethnicity was unknown. This number is then divided by the total number of students at the school to obtain the racial-ethnic minorities percentage.
- College Factual
- National Center for Education Statistics
- Image Credit: By n/a under License
More about our data sources and methodologies.
Course Advisor provides higher-education, college and university, degree, program, career, salary, and other helpful information to students, faculty, institutions, and other internet audiences. Presented information and data are subject to change. Inclusion on this website does not imply or represent a direct relationship with the company, school, or brand. Information, though believed correct at time of publication, may not be correct, and no warranty is provided. Contact the schools to verify any information before relying on it. Financial aid may be available for those who qualify. The displayed options may include sponsored or recommended results, not necessarily based on your preferences.
© Course Advisor – All Rights Reserved.