Randolph - Macon College Overview
Located in Ashland, Virginia, Randolph - Macon College is a private not-for-profit institution. Randolph - Macon is located in a safe and convenient suburb.
What Is Randolph - Macon College Known For?
- Randolph - Macon has an impressive student to faculty ratio of 10 to 1.
- The highest award offered at Randolph - Macon is the master's degree.
- During a recent academic cycle, 64% of the faculty were full-time.
- Students who graduate from Randolph - Macon with a bachelor's degree make about $58,448 a year. That's 43% more than those who graduate from other schools.
- On average, it takes about 4.1 years for students from Randolph - Macon to earn a bachelor's degree. This is excellent when compared to the average of 4.4 years.
Where Is Randolph - Macon College?
Contact details for Randolph - Macon are given below.
| Contact Details | |
|---|---|
| Address: | 204 Henry St, Ashland, VA 23005-5505 |
| Phone: | 804-752-7200 |
| Website: | www.rmc.edu |
How Do I Get Into Randolph - Macon?
You can apply to Randolph - Macon online at: https://www.rmc.edu/admissions-and-aid/how-to-apply/
Admission Requirements for Randolph - Macon
| Submission | Required? |
|---|---|
| High School GPA | 1 |
| High School Rank | 5 |
| High School Transcript | 1 |
| College Prep Program | 1 |
| Recommendations | 1 |
| SAT or ACT Scores | 5 |
| TOEFL | 1 |
How Hard Is It To Get Into Randolph - Macon?
Approximately 50% of accepted students are men and 50% are women. The acceptance rate for men is 85%, and the acceptance rate for women is 86%.
Average Test Scores
About 45% of students accepted to Randolph - Macon submitted their SAT scores. When looking at the 25th through the 75th percentile, SAT Evidence-Based Reading and Writing scores ranged between 520 and 630. Math scores were between 500 and 590.
Can I Afford Randolph - Macon College?
The net price is calculated by adding tuition, room, board and other costs and subtracting financial aid.
Student Loan Debt
Almost 66% of college students who graduated with the class of 2018 took out student loans, but that percentage varies from school to school. At Randolph - Macon, approximately 61% of students took out student loans averaging $5,272 a year. That adds up to $21,088 over four years for those students.
Explore Best Ranked Schools for You
Randolph - Macon College Undergraduate Student Diversity
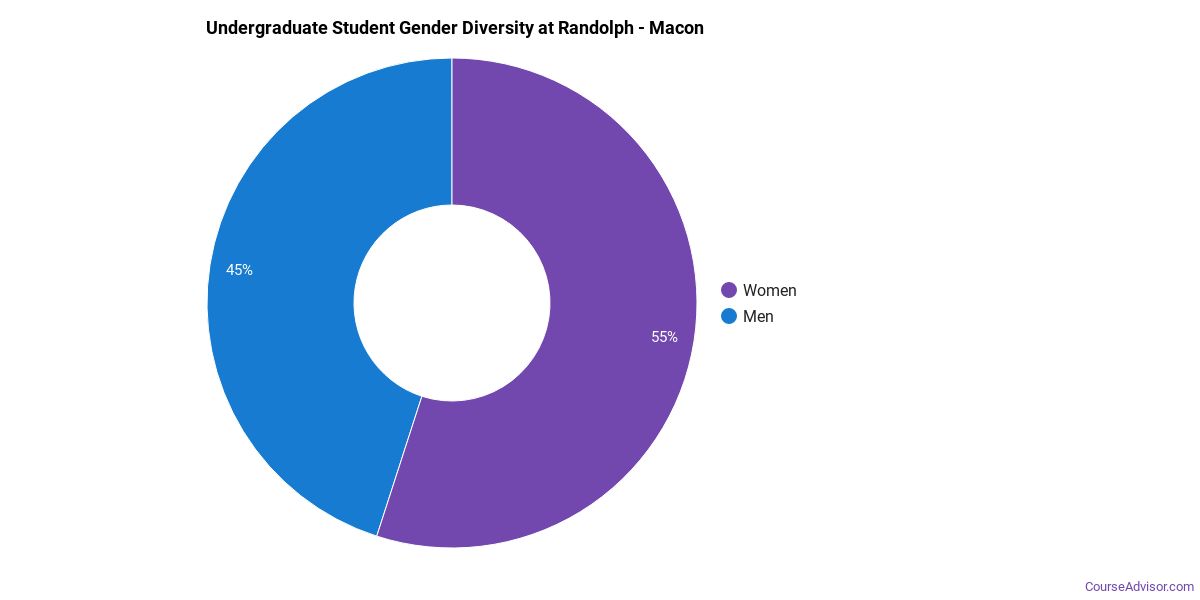
Gender Diversity
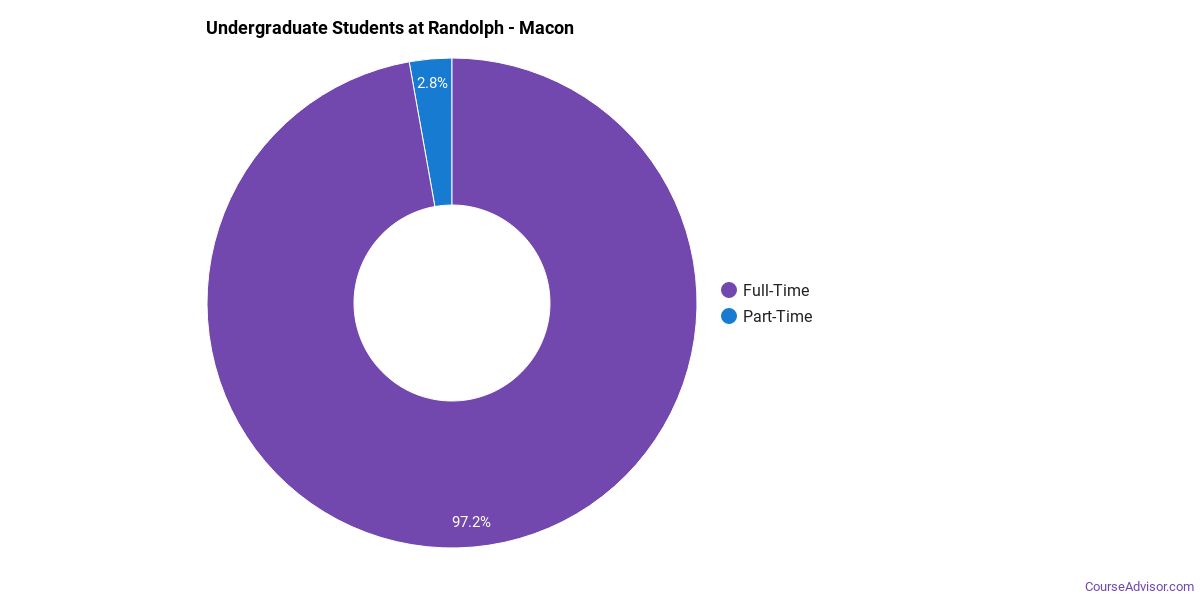
Of the 1,531 full-time undergraduates at Randolph - Macon, 45% are male and 55% are female.
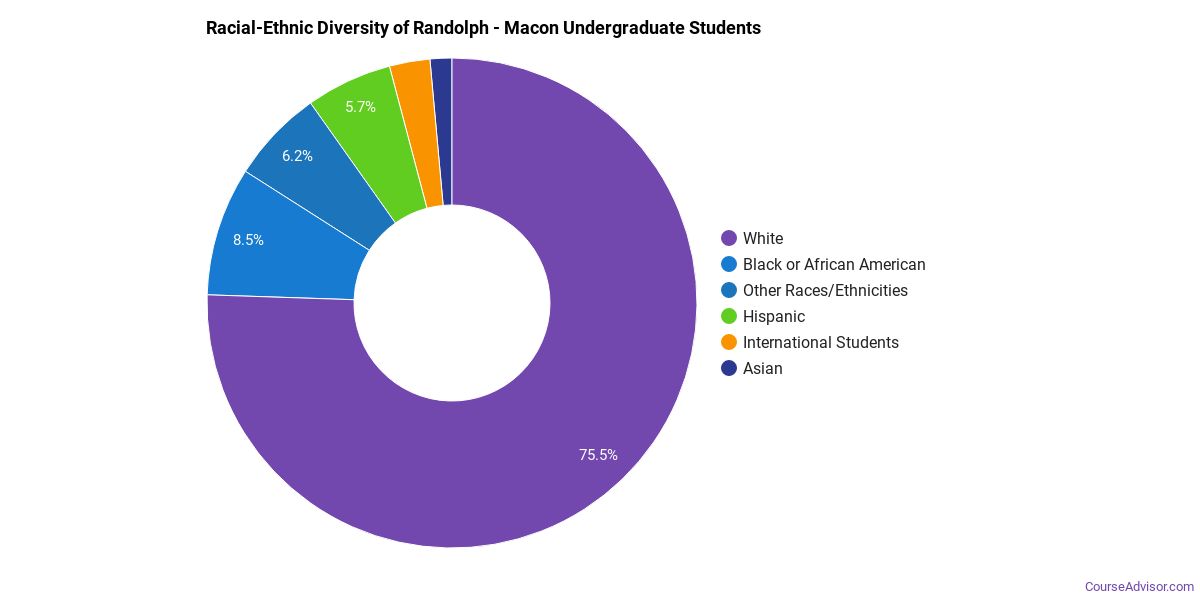
Racial-Ethnic Diversity
The racial-ethnic breakdown of Randolph - Macon College students is as follows.
| Race/Ethnicity | Number of Grads |
|---|---|
| Asian | 21 |
| Black or African American | 138 |
| Hispanic or Latino | 86 |
| White | 1,163 |
| International Students | 30 |
| Other Races/Ethnicities | 93 |
Geographic Diversity
Virginia students aren't the only ones who study at Randolph - Macon College. At this time, 16 states are represented by the student population at the school.
Over 19 countries are represented at Randolph - Macon. The most popular countries sending students to the school are Vietnam, Japan, and Myanmar/Burma.
Randolph - Macon College Undergraduate Concentrations
The table below shows the number of awards for each concentration.
| Major | Bachelor’s | TOTAL |
|---|---|---|
| General Business/Commerce | 65 | 65 |
| General Biology | 46 | 46 |
| Nursing | 36 | 36 |
| General Psychology | 24 | 24 |
| Political Science & Government | 22 | 22 |
| Computer Information Systems | 21 | 21 |
| Information Technology | 19 | 19 |
| Sociology | 16 | 16 |
| Communication & Media Studies | 13 | 13 |
| Chemistry | 13 | 13 |
| Criminology | 12 | 12 |
| Accounting | 10 | 10 |
| Romance Languages | 10 | 10 |
| Natural Resources Conservation | 10 | 10 |
| Neurobiology & Neurosciences | 9 | 9 |
| General English Literature | 7 | 7 |
| History | 7 | 7 |
| Classical & Ancient Studies | 7 | 7 |
| Music | 7 | 7 |
| General Engineering | 6 | 6 |
| Religious Studies | 6 | 6 |
| Drama & Theater Arts | 5 | 5 |
| Area Studies | 4 | 4 |
| Classical Languages & Literature | 4 | 4 |
| Economics | 4 | 4 |
| Fine & Studio Arts | 4 | 4 |
| Engineering Physics | 3 | 3 |
| Physics | 3 | 3 |
| Arts & Media Management | 3 | 3 |
| Writing Studies | 2 | 2 |
| Mathematics | 2 | 2 |
| Ethnic Studies | 1 | 1 |
| Applied Mathematics | 1 | 1 |
| International Studies | 1 | 1 |
| Philosophy | 1 | 1 |
| General Education | 0 | 0 |
| Special Education | 0 | 0 |
| Teacher Education Grade Specific | 0 | 0 |
| Germanic Languages | 0 | 0 |
| Allied Health Professions | 0 | 0 |
| TOTAL | 404 | 404 |
References
*The racial-ethnic minorities count is calculated by taking the total number of students and subtracting white students, international students, and students whose race/ethnicity was unknown. This number is then divided by the total number of students at the school to obtain the racial-ethnic minorities percentage.
- College Factual
- National Center for Education Statistics
- Image Credit: By JERRYE & ROY KLOTZ MD under License
More about our data sources and methodologies.
Course Advisor provides higher-education, college and university, degree, program, career, salary, and other helpful information to students, faculty, institutions, and other internet audiences. Presented information and data are subject to change. Inclusion on this website does not imply or represent a direct relationship with the company, school, or brand. Information, though believed correct at time of publication, may not be correct, and no warranty is provided. Contact the schools to verify any information before relying on it. Financial aid may be available for those who qualify. The displayed options may include sponsored or recommended results, not necessarily based on your preferences.
© Course Advisor – All Rights Reserved.