Other Health Professions at Quinnipiac University
If you plan to study Other Health Professions, take a look at what Quinnipiac University. Get started with the following essential facts.
Quinnipiac University sits in Hamden, CT.
In the most recent year for which we have data, 283 other health professions degrees were awarded at Quinnipiac University.
Featured schools near , edit
Studying Online at Quinnipiac University
Online coursework is an option at Quinnipiac University. Of 9,424 students, 984 (10%) studied exclusively online and 3,168 (34%) took at least some classes online.
Other Health Professions Rankings at Quinnipiac University
These rankings give you a sense of how Quinnipiac University’s Other Health Professions program to other colleges that offer this major.
Bachelor’s-Level Rankings
| Ranking | Scope | Rank |
|---|---|---|
| Best Schools (Quality) | Connecticut | #2 of 4 |
| Best Schools (Quality) | New England (Region) | #3 of 6 |
| Best Value | Connecticut | #4 of 4 |
| Best Value | New England (Region) | #6 of 6 |
| Best Schools (Quality) | Nationwide | #33 of 111 |
| Best Value | Nationwide | #105 of 109 |
Master’s-Level Rankings
| Ranking | Scope | Rank |
|---|---|---|
| Best Schools (Quality) | Connecticut | #2 of 4 |
| Best Schools (Quality) | New England (Region) | #3 of 6 |
| Best Value | Connecticut | #4 of 4 |
| Best Value | New England (Region) | #6 of 6 |
| Best Schools (Quality) | Nationwide | #33 of 111 |
| Best Value | Nationwide | #105 of 109 |
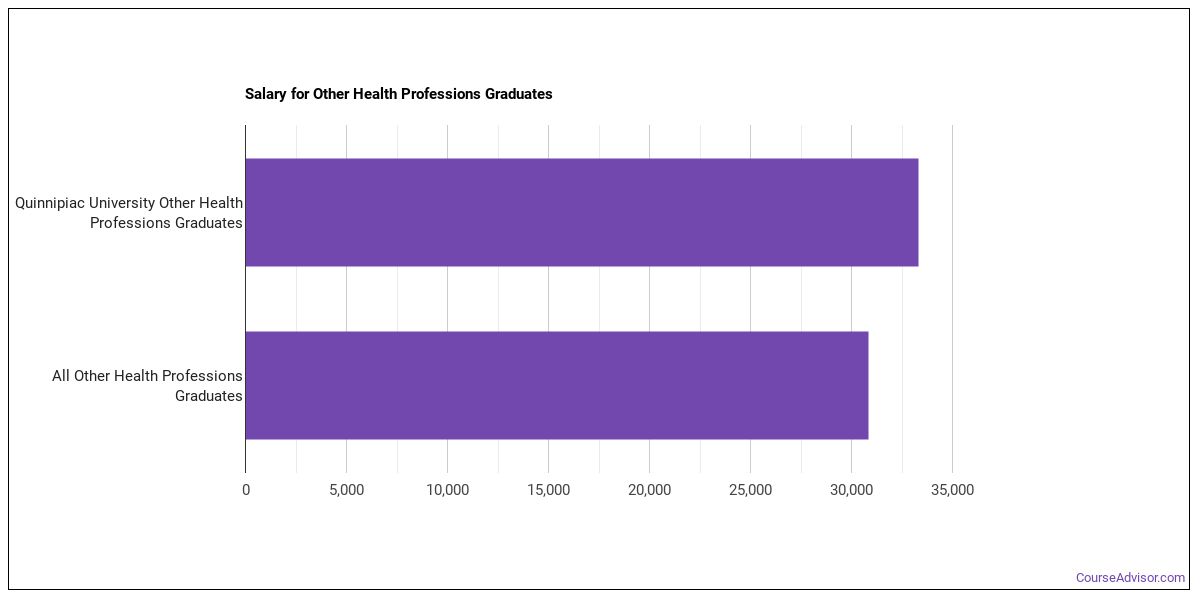
Earnings for Other Health Professions Graduates from Quinnipiac University
Those who finish Quinnipiac University’s Other Health Professions program report the following median earnings (per the U.S. Department of Education’s College Scorecard):
| Years After Graduation | Median Earnings |
|---|---|
| 1 year | $33,323 |
| 2 years | $31,133 |
| 3 years | $41,225 |
| 4 years | $58,098 |
| 5 years | $77,782 |
Is this above or below average for the school? Four years after graduating, Other Health Professions graduates from Quinnipiac University earn a median of $58,098, compared with $76,889 for all Quinnipiac University graduates — about 24% lower than the school-wide median.

Median Debt at Graduation
Median student loan debt for Other Health Professions graduates from Quinnipiac University is $26,000.
Student Demographics & Diversity
The following sections describe the composition of Other Health Professions graduates at Quinnipiac University, by degree type.
Looking at the program as a whole, Other Health Professions graduates at Quinnipiac University are 81% women (230) and 19% men (53).
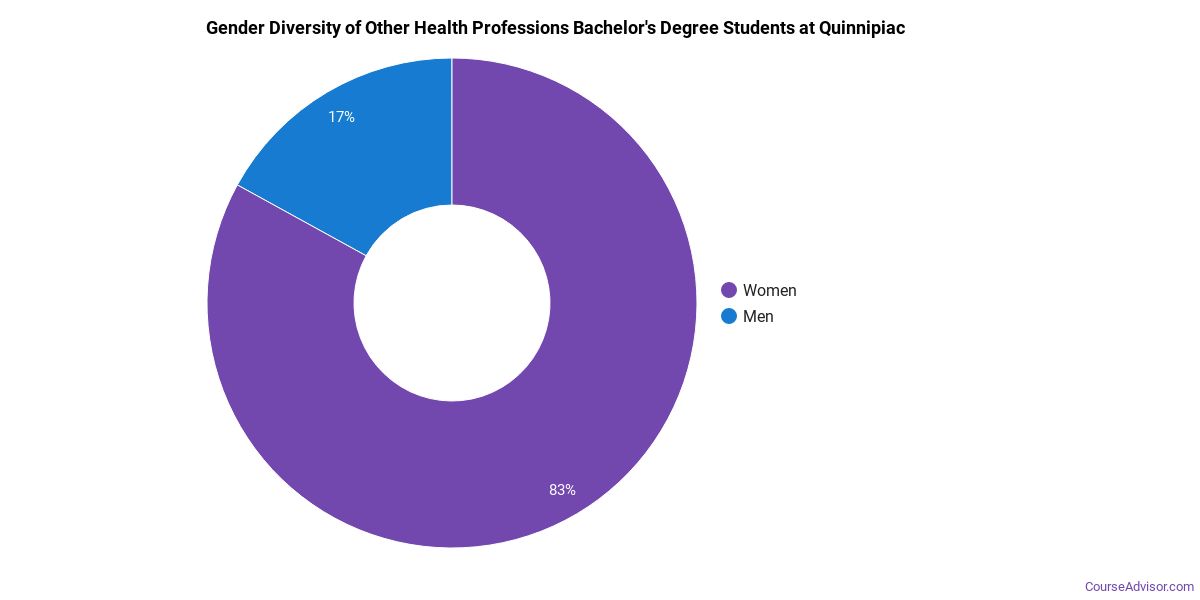
Other Health Professions Bachelor’s Program at Quinnipiac University
Of the 283 bachelor’s other health professions graduates at Quinnipiac University, 81% were women (230) and 19% were men (53).
The following table and chart show the race/ethnicity of Other Health Professions bachelor’s degree recipients at Quinnipiac University.
| Race / Ethnicity | Number of Graduates |
|---|---|
| White | 224 |
| Hispanic / Latino | 26 |
| Black / African American | 3 |
| Asian | 13 |
| Two or More Races | 10 |
| International (Nonresident) | 5 |
| Unknown | 2 |
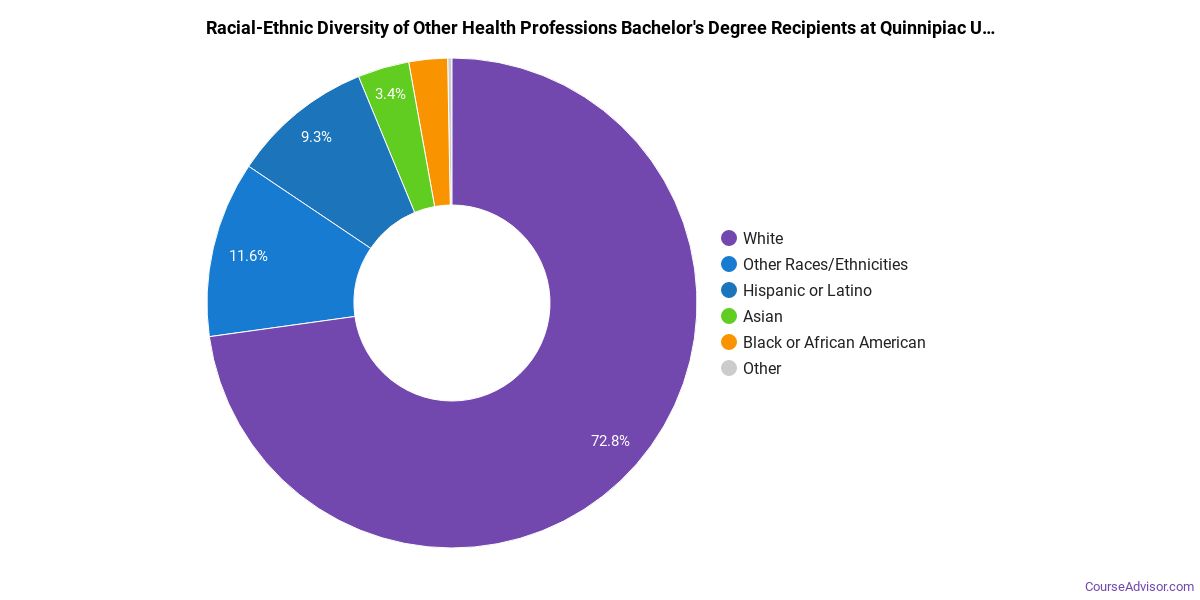
Racial-ethnic minorities make up 18% of Other Health Professions bachelor’s degree recipients at Quinnipiac University, lower than the national average of 34%.*
*The racial-ethnic minorities figure is the total number of graduates minus White, international (nonresident), and unknown-race graduates.
More Specific Other Health Professions Concentrations at Quinnipiac University
This Other Health Professions program at Quinnipiac University breaks down into more specific concentrations:
| Concentration | Graduates |
|---|---|
| Other Health & Clinical Sciences | 283 |
References
- IPEDS — Integrated Postsecondary Education Data System
- U.S. Department of Education — College Scorecard
- O*NET Online (Bureau of Labor Statistics)
- National Center for Education Statistics
More about our data sources and methodologies.
Course Advisor provides higher-education, college and university, degree, program, career, salary, and other helpful information to students, faculty, institutions, and other internet audiences. Presented information and data are subject to change. Inclusion on this website does not imply or represent a direct relationship with the company, school, or brand. Information, though believed correct at time of publication, may not be correct, and no warranty is provided. Contact the schools to verify any information before relying on it. Financial aid may be available for those who qualify. The displayed options may include sponsored or recommended results, not necessarily based on your preferences.
© Course Advisor – All Rights Reserved.