Radio, Television & Digital Communication at Quinnipiac University
Every radio, television & digital communication school has its own distinct culture and strengths. We've pulled together some statistics and other details to help you see how the digital communication program at Quinnipiac University stacks up to those at other schools.Quinnipiac is located in Hamden, Connecticut and approximately 9,746 students attend the school each year.
Want to know more about the career opportunities in this field? Check out the Careers in Radio, Television & Digital Communication section at the bottom of this page.
Featured Quinnipiac University Programs
Learn about start dates, transferring credits, availability of financial aid, and more by contacting the universities below.
BA in Communication - New Media
Explore the digital frontier as it relates to today's communications strategies with this specialized online bachelor's from Southern New Hampshire University.

MS in Marketing - New Media & Communications
Explore how emerging media impacts the study of culture, relationships and messages with this online master's from Southern New Hampshire University.
Quinnipiac Radio, Television & Digital Communication Degrees Available
- Master’s Degree in Digital Communication
Featured Quinnipiac University Programs
Learn about start dates, transferring credits, availability of financial aid, and more by contacting the universities below.
BA in Communication - New Media
Explore the digital frontier as it relates to today's communications strategies with this specialized online bachelor's from Southern New Hampshire University.
MS in Marketing - New Media & Communications
Explore how emerging media impacts the study of culture, relationships and messages with this online master's from Southern New Hampshire University.
Quinnipiac Radio, Television & Digital Communication Rankings
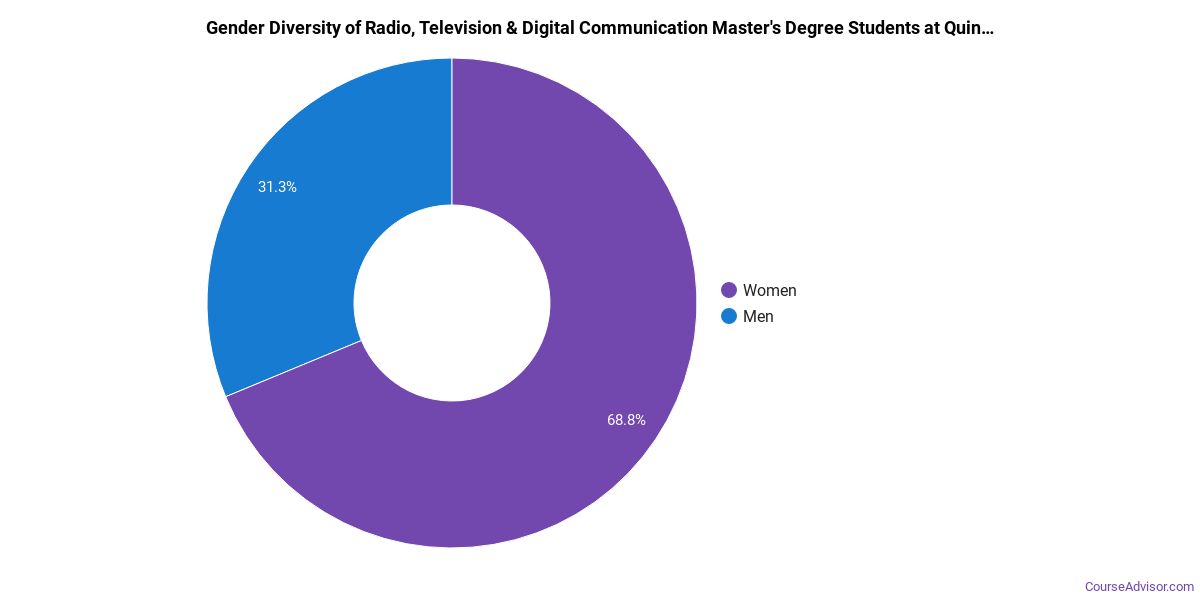
Digital Communication Student Demographics at Quinnipiac
Take a look at the following statistics related to the make-up of the digital communication majors at Quinnipiac University.
Quinnipiac Radio, Television & Digital Communication Master’s Program
Of the students who received a digital communication master's degree from Quinnipiac, 89% were white. This is above average for this degree on the natiowide level.
The following table and chart show the race/ethnicity for students who recently graduated from Quinnipiac University with a master's in digital communication.
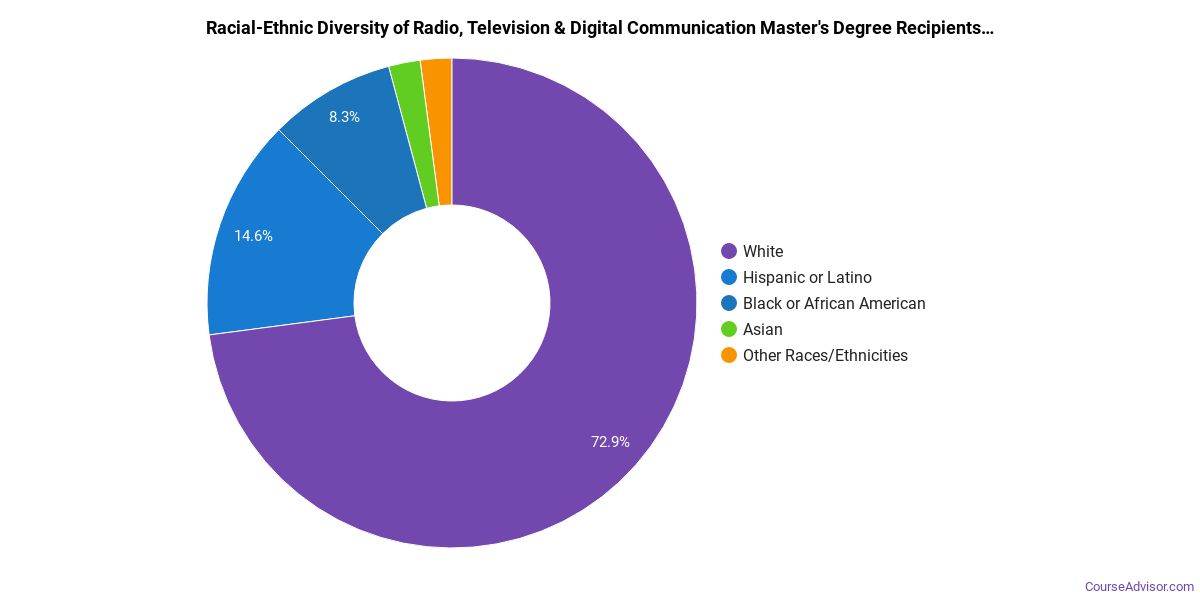
| Race/Ethnicity | Number of Students |
|---|---|
| Asian | 0 |
| Black or African American | 1 |
| Hispanic or Latino | 2 |
| White | 25 |
| International Students | 0 |
| Other Races/Ethnicities | 0 |
Concentrations Within Radio, Television & Digital Communication
Radio, Television & Digital Communication majors may want to concentrate their studies in one of these areas. The completion numbers here include all graduates who receive any type of degree in this field from Quinnipiac University. Some of these focus areas may not be available for your degree level.
| Concentration | Annual Degrees Awarded |
|---|
Related Majors
Related Programs
Learn about other programs related to Quinnipiac University that might interest you.
MS in Marketing - New Media & Communications
Explore how emerging media impacts the study of culture, relationships and messages with this online master's from Southern New Hampshire University.
Careers That Digital Communication Grads May Go Into
A degree in digital communication can lead to the following careers. Since job numbers and average salaries can vary by geographic location, we have only included the numbers for CT, the home state for Quinnipiac University.
| Occupation | Jobs in CT | Average Salary in CT |
|---|---|---|
| Managers | 6,590 | $129,730 |
| Producers and Directors | 1,800 | $84,900 |
| Radio and Television Announcers | 390 | $42,320 |
| Film and Video Editors | 310 | $73,710 |
| Media and Communication Workers | 270 | $50,560 |
References
*The racial-ethnic minorities count is calculated by taking the total number of students and subtracting white students, international students, and students whose race/ethnicity was unknown. This number is then divided by the total number of students at the school to obtain the racial-ethnic minorities percentage.
- College Factual
- National Center for Education Statistics
- O*NET Online
- Image Credit: By JlsElsewhere under License
More about our data sources and methodologies.
Course Advisor provides higher-education, college and university, degree, program, career, salary, and other helpful information to students, faculty, institutions, and other internet audiences. Presented information and data are subject to change. Inclusion on this website does not imply or represent a direct relationship with the company, school, or brand. Information, though believed correct at time of publication, may not be correct, and no warranty is provided. Contact the schools to verify any information before relying on it. Financial aid may be available for those who qualify. The displayed options may include sponsored or recommended results, not necessarily based on your preferences.
© Course Advisor – All Rights Reserved.