Quinebaug Valley Community College Overview
Located in Danielson, Connecticut, Quinebaug Valley Community College is a public institution. Danielson is a good match for students who enjoy the safety and convenience of the suburbs.
What Is Quinebaug Valley Community College Known For?
- The associate's degree is the highest award offered at QVCC.
- In 2021-2022, 23% of the faculty were full-time.
Featured schools near , edit
Where Is Quinebaug Valley Community College?

Contact details for QVCC are given below.
| Contact Details | |
|---|---|
| Address: | 742 Upper Maple St, Danielson, CT 06239-1436 |
| Phone: | 860-932-4000 |
| Website: | qvcc.edu |
How Do I Get Into QVCC?
You can apply to QVCC online at: https://qvcc.edu/application/
Can I Afford Quinebaug Valley Community College?
Quinebaug Valley Community College Undergraduate Student Diversity

Gender Diversity
Of the 405 full-time undergraduates at QVCC, 39% are male and 61% are female.

Racial-Ethnic Diversity
The racial-ethnic breakdown of Quinebaug Valley Community College students is as follows.

| Race/Ethnicity | Number of Grads |
|---|---|
| Asian | 5 |
| Black or African American | 9 |
| Hispanic or Latino | 50 |
| White | 320 |
| International Students | 0 |
| Other Races/Ethnicities | 21 |
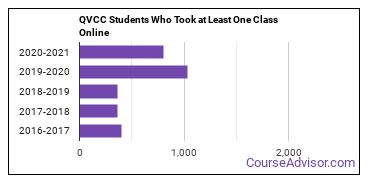
Online Learning at Quinebaug Valley Community College
The following chart shows how the online learning population at QVCC has changed over the last few years.

Quinebaug Valley Community College Undergraduate Concentrations
The table below shows the number of awards for each concentration.
References
*The racial-ethnic minorities count is calculated by taking the total number of students and subtracting white students, international students, and students whose race/ethnicity was unknown. This number is then divided by the total number of students at the school to obtain the racial-ethnic minorities percentage.
More about our data sources and methodologies.
Featured Schools
 Request Info
|
Southern New Hampshire University You have goals. Southern New Hampshire University can help you get there. Whether you need a bachelor's degree to get into a career or want a master's degree to move up in your current career, SNHU has an online program for you. Find your degree from over 200 online programs. Learn More > |
