Providence College Science & Tech Programs
Providence College is a private not-for-profit institution located in Providence, RI. A Mid-Sized City offers an ideal setting close to urban amenities.
Featured schools near , edit
Providence College Rankings
Providence College has earned the following rankings for science & tech programs at the bachelors level:
| Ranking | Rank | Among |
|---|---|---|
| Overall Quality | #2 of 20 | State — Rhode Island |
| Overall Quality | #10 of 254 | Region — New England |
| Overall Quality | #118 of 4,630 | Nationwide |
Where Is Providence College?
Get in touch with Providence College are given below.
| Contact Details | |
|---|---|
| Address: | 1 Cunningham Square, Providence, RI 02918-0001 |
| Phone: | 4018651000 |
| Website: | www.providence.edu/ |
| Admissions: | admission.providence.edu/ |
| Financial Aid: | financial-aid.providence.edu/ |
How Do I Get Into Providence College?
You can apply to Providence College online at: https://admission.providence.edu/apply/
Providence College is classified as Moderately Selective (50-70%) for admissions.
Admission Requirements for Providence College
This is what Providence College looks for in applicants:
| Requirement | Status |
|---|---|
| Secondary School Record | Required |
| Secondary School GPA | Required |
| Recommendations | Required |
| Admission Test Scores (SAT/ACT) | Considered but not required |
How Hard Is It To Get Into Providence College?
Providence College maintains an acceptance rate of 51%, which means it is fairly accessible. Ensure you meet all application requirements and prepare the application in full.
Of those admitted, 19% choose to enroll — a modest enrollment yield, suggesting many admitted students choose other institutions.
Average Test Scores
19% of admitted students submitted SAT scores and 5% submitted ACT scores.
When looking at the 25th through the 75th percentile of admitted students at Providence College, SAT Evidence-Based Reading and Writing scores ranged between 630 and 700. Math scores were between 620 and 690.
Selectivity by Gender
Admit rates at Providence College vary modestly across gender.
| Gender | Applicants | Admitted | Acceptance Rate |
|---|---|---|---|
| Men | 5,188 | 2,771 | 53% |
| Women | 7,332 | 3,601 | 49% |
Can I Afford Providence College?
The average net price after aid at Providence College is $45,538. Cost varies significantly based on your financial situation since net price varies by income group.
Tuition & Fees
| Category | Cost |
|---|---|
| In-State Tuition | $62,520 |
| In-State Fees | $1,030 |
| Out-of-State Tuition | $62,520 |
| Out-of-State Fees | $1,030 |
| Total In-State Tuition & Fees | $63,550 |
| Total Out-of-State Tuition & Fees | $63,550 |
Financial Aid
When including loans, work-study, and grants, 28% of students at Providence College receive some form of financial aid (1,191 students).
About 78% of students at Providence College receive grant or scholarship aid, averaging $32,482 per student.
13% of students receive federal Pell Grants, averaging $5,452.
Student Loan Debt
57% of Providence College undergraduates take out federal student loans, averaging $6,475 per year.
Providence College Undergraduate Student Diversity
There are 588 students enrolled at Providence College. Providence College is classified as a 1,000 - 4,999 institution by enrollment size. Its Carnegie Classification is Master’s Colleges & Universities: Larger Programs.
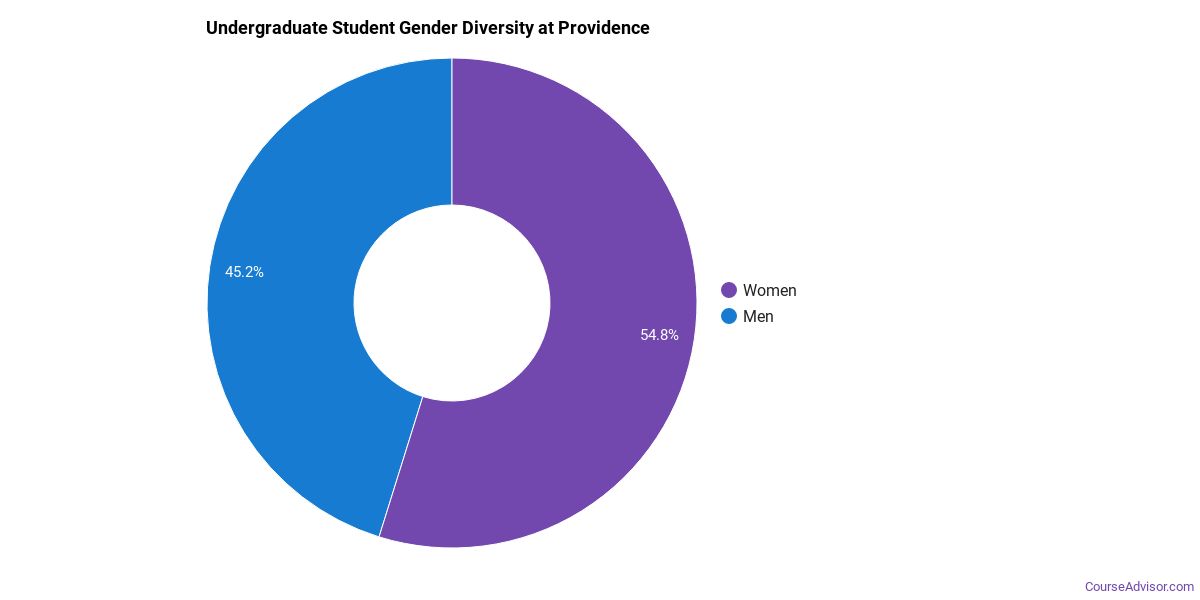
Gender Diversity
Of the 4,170 undergraduate students at Providence College, approximately 46% are male and 54% are female.
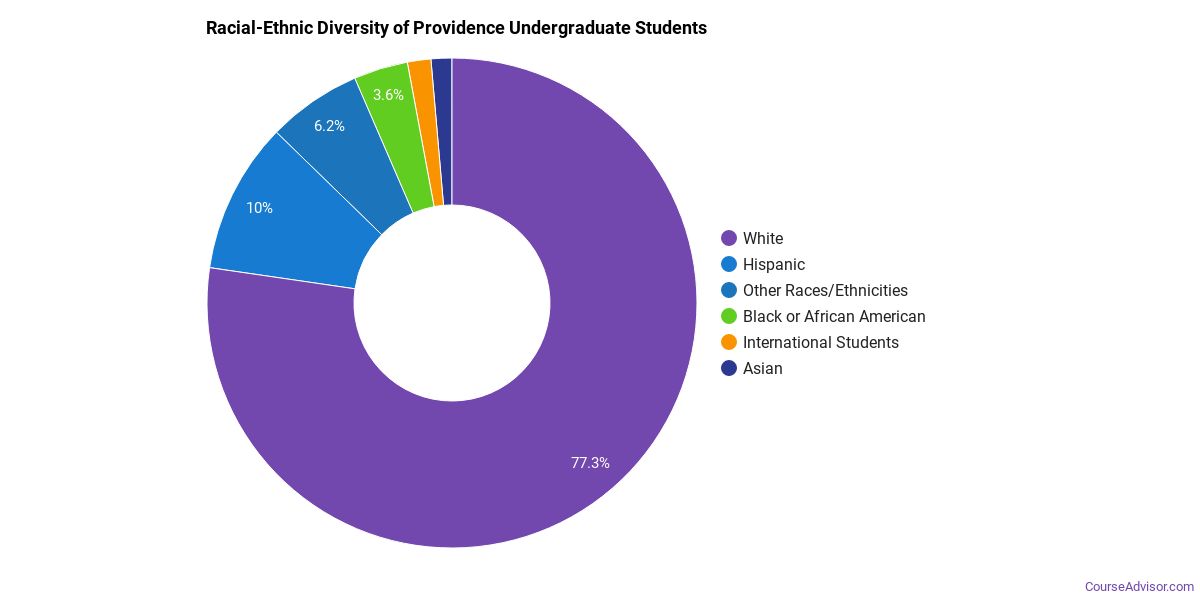
Racial-Ethnic Diversity
The racial-ethnic breakdown of Providence College undergraduate students is as follows.
| Race/Ethnicity | Number of Students |
|---|---|
| Asian | 54 |
| Black or African American | 100 |
| Hispanic | 366 |
| White | 3,302 |
| Native Hawaiian/Pacific Islander | 4 |
| Two or More Races | 108 |
| Non-Resident | 70 |
Geographic Diversity
The top 5 home states of first-time undergraduate students at Providence College are shown below.

| State | First-Time UG Students |
|---|---|
| Massachusetts | 448 |
| New York | 183 |
| Connecticut | 161 |
| New Jersey | 125 |
| Rhode Island | 104 |
Additionally, approximately 1.7% of undergraduate students are non-resident from outside the United States.
Providence College Graduate Student Diversity
444 of Providence College’s students are in graduate programs. The highest graduate-level award offered is Master’s degree.
Gender Diversity (Graduate)
Among graduate students at Providence College, approximately 39% are male and 61% are female.

Racial-Ethnic Diversity (Graduate)
The racial-ethnic breakdown of Providence College graduate students is as follows.

| Race/Ethnicity | Number of Students |
|---|---|
| Asian | 10 |
| Black or African American | 16 |
| Hispanic | 26 |
| White | 330 |
| American Indian/Alaska Native | 0 |
| Two or More Races | 32 |
| Non-Resident | 18 |
Online Learning at Providence College
Providence College provides remote learning paths for students who need flexibility.
52 undergraduate students at Providence College took at least one online class — of those, 32 took all of their classes online.
At the graduate level, 147 students took at least one online class and 13 took all classes online. Distance education is available at the undergraduate and graduate levels.
Academic Programs at Providence College
Providence College offers 25 distinct academic programs.
The highest level of award offered is Master’s degree.
Institutional Profile
Providence College has an open admission policy: No. Credit transfer:
- AP credits: Yes
- Dual enrollment credits: Yes
- Life experience credits: Implied no
References
More about our data sources and methodologies.
Course Advisor provides higher-education, college and university, degree, program, career, salary, and other helpful information to students, faculty, institutions, and other internet audiences. Presented information and data are subject to change. Inclusion on this website does not imply or represent a direct relationship with the company, school, or brand. Information, though believed correct at time of publication, may not be correct, and no warranty is provided. Contact the schools to verify any information before relying on it. Financial aid may be available for those who qualify. The displayed options may include sponsored or recommended results, not necessarily based on your preferences.
© Course Advisor – All Rights Reserved.