Public Policy at Princeton University
If you plan to study Public Policy, consider the program at Princeton University. Get started with the following essential facts.
Princeton University is located in Princeton, NJ.
In the most recent year for which we have data, 227 public policy degrees were awarded at Princeton University.
Featured schools near , edit
Online Class Availability at Princeton University
Princeton University delivers most coursework on campus; distance-education enrollment is limited.
Public Policy Rankings at Princeton University
Use these rankings to compare Princeton University’s Public Policy program against other schools offering the same major.
Bachelor’s-Level Rankings
| Ranking | Scope | Rank |
|---|---|---|
| Best Value | Middle Atlantic (Region) | #1 of 25 |
| Best Value | New Jersey | #1 of 4 |
| Best Schools (Quality) | New Jersey | #2 of 4 |
| Best Value | Nationwide | #2 of 95 |
| Best Schools (Quality) | Middle Atlantic (Region) | #11 of 25 |
| Best Schools (Quality) | Nationwide | #18 of 96 |
Master’s-Level Rankings
| Ranking | Scope | Rank |
|---|---|---|
| Best Value | Middle Atlantic (Region) | #1 of 25 |
| Best Value | New Jersey | #1 of 4 |
| Best Schools (Quality) | New Jersey | #2 of 4 |
| Best Value | Nationwide | #2 of 95 |
| Best Schools (Quality) | Middle Atlantic (Region) | #11 of 25 |
| Best Schools (Quality) | Nationwide | #18 of 96 |
Doctoral-Level Rankings
| Ranking | Scope | Rank |
|---|---|---|
| Best Value | Middle Atlantic (Region) | #1 of 25 |
| Best Value | New Jersey | #1 of 4 |
| Best Schools (Quality) | New Jersey | #2 of 4 |
| Best Value | Nationwide | #2 of 95 |
| Best Schools (Quality) | Middle Atlantic (Region) | #11 of 25 |
| Best Schools (Quality) | Nationwide | #18 of 96 |
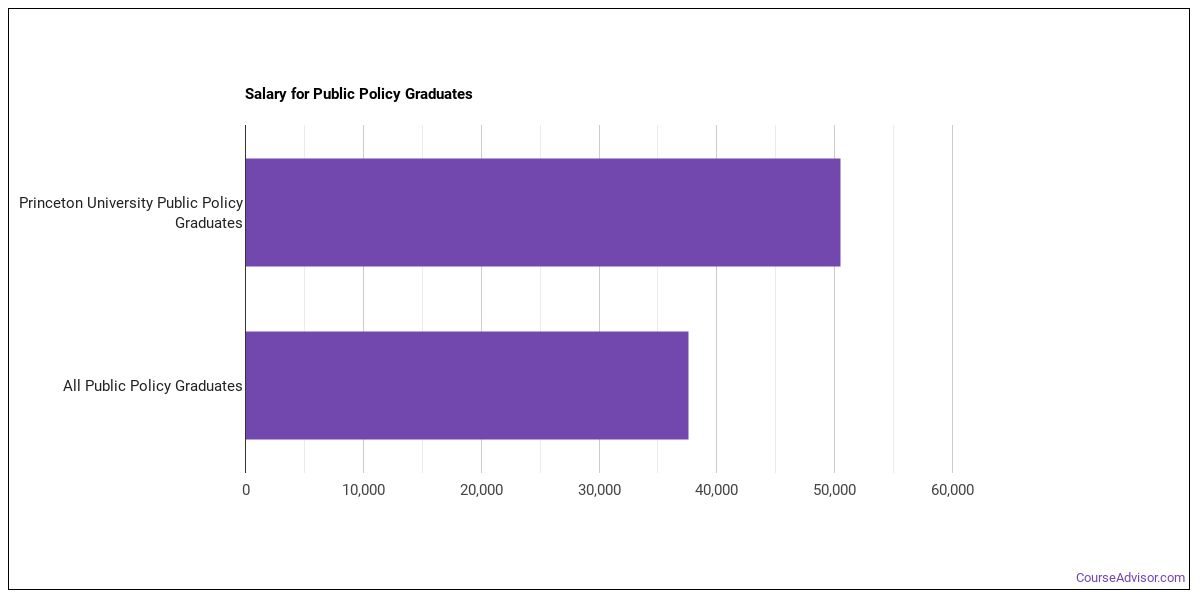
Earnings for Public Policy Graduates from Princeton University
Graduates of Princeton University’s Public Policy program report the following median earnings (per the U.S. Department of Education’s College Scorecard):
| Years After Graduation | Median Earnings |
|---|---|
| 1 year | $60,713 |
| 2 years | $67,609 |
| 3 years | $85,666 |
| 4 years | $97,336 |
| 5 years | $106,153 |
Is this above or below average for the school? Four years out, Public Policy graduates from Princeton University earn a median of $97,336, compared with $97,336 for all Princeton University graduates — about 0% higher than the school-wide median.

Median Debt at Graduation
Median student loan debt for Public Policy graduates from Princeton University comes in at $10,527.
Student Demographics & Diversity
The following sections describe the student demographics for Public Policy graduates at Princeton University, by degree type.
Across all degree levels, Public Policy graduates at Princeton University are 62% women (140) and 38% men (87).
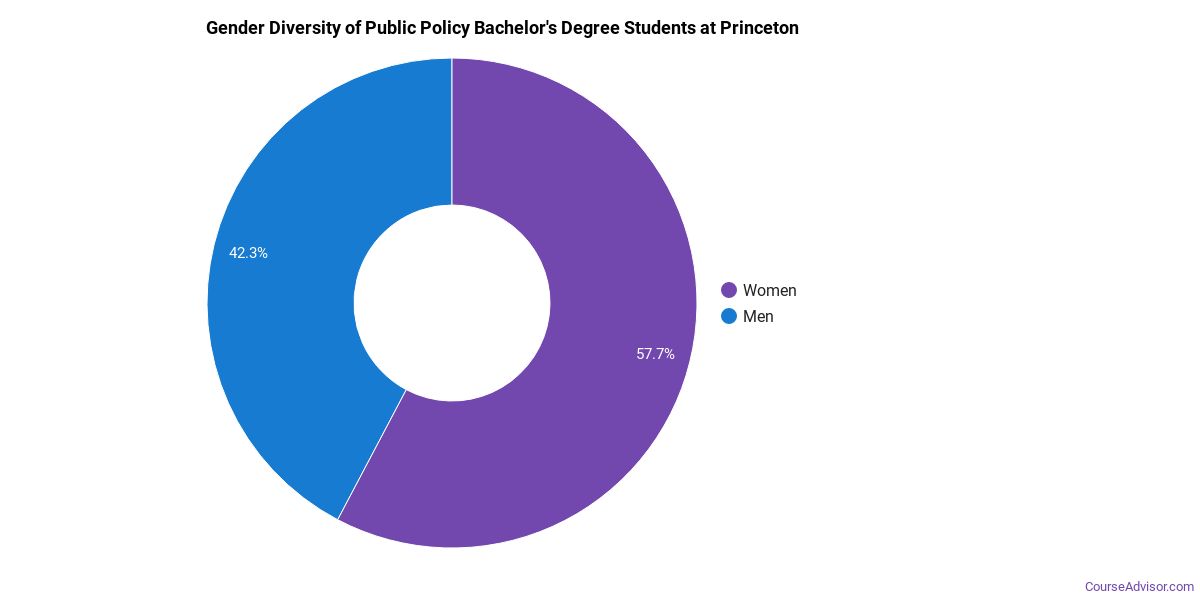
Public Policy Bachelor’s Program at Princeton University
Of the 130 bachelor’s public policy degrees awarded at Princeton University, 65% were women (84) and 35% were men (46).
The following table and chart show the race/ethnicity of Public Policy bachelor’s degree recipients at Princeton University.
| Race / Ethnicity | Number of Graduates |
|---|---|
| White | 65 |
| Hispanic / Latino | 8 |
| Black / African American | 15 |
| Asian | 20 |
| Two or More Races | 12 |
| International (Nonresident) | 9 |
| Unknown | 1 |
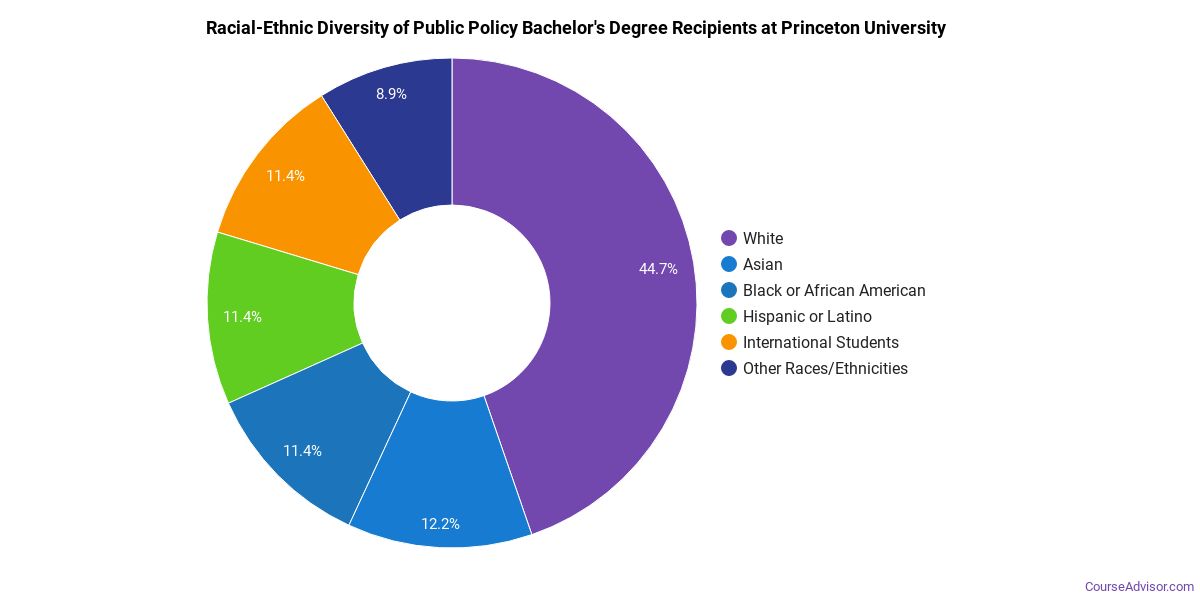
Minority students account for 42% of Public Policy bachelor’s degree recipients at Princeton University, below the national average of 45%.*
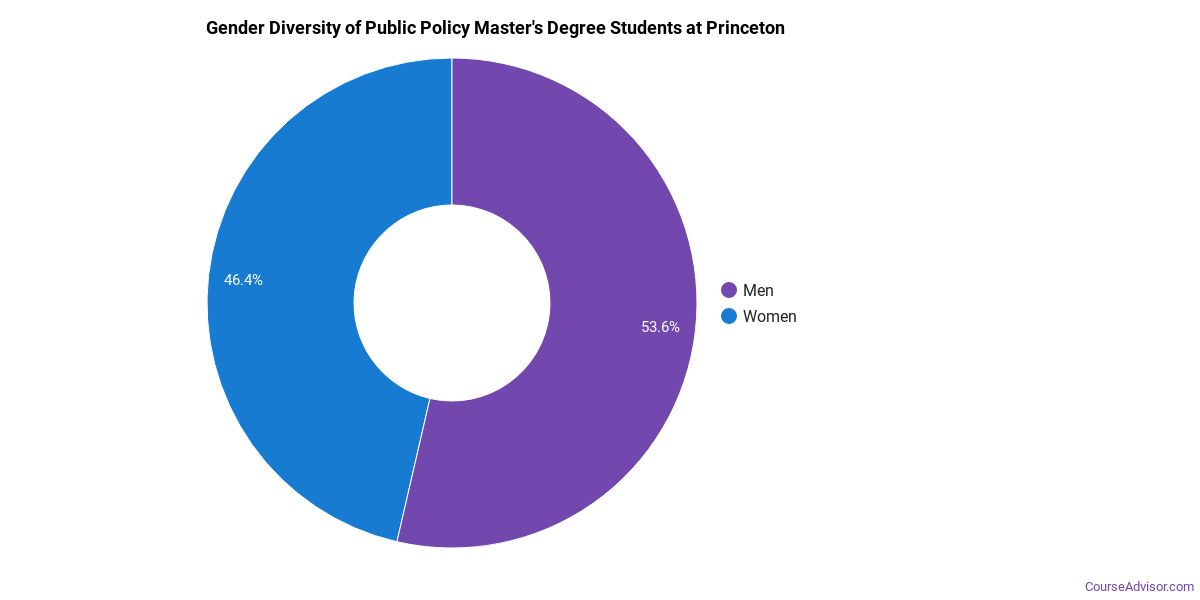
Public Policy Master’s Program at Princeton University
Among the 92 master’s public policy degrees awarded at Princeton University, 59% were women (54) and 41% were men (38).
The following table and chart show the race/ethnicity of Public Policy master’s degree recipients at Princeton University.
| Race / Ethnicity | Number of Graduates |
|---|---|
| White | 31 |
| Hispanic / Latino | 12 |
| Black / African American | 8 |
| Asian | 8 |
| Two or More Races | 1 |
| International (Nonresident) | 27 |
| Unknown | 5 |
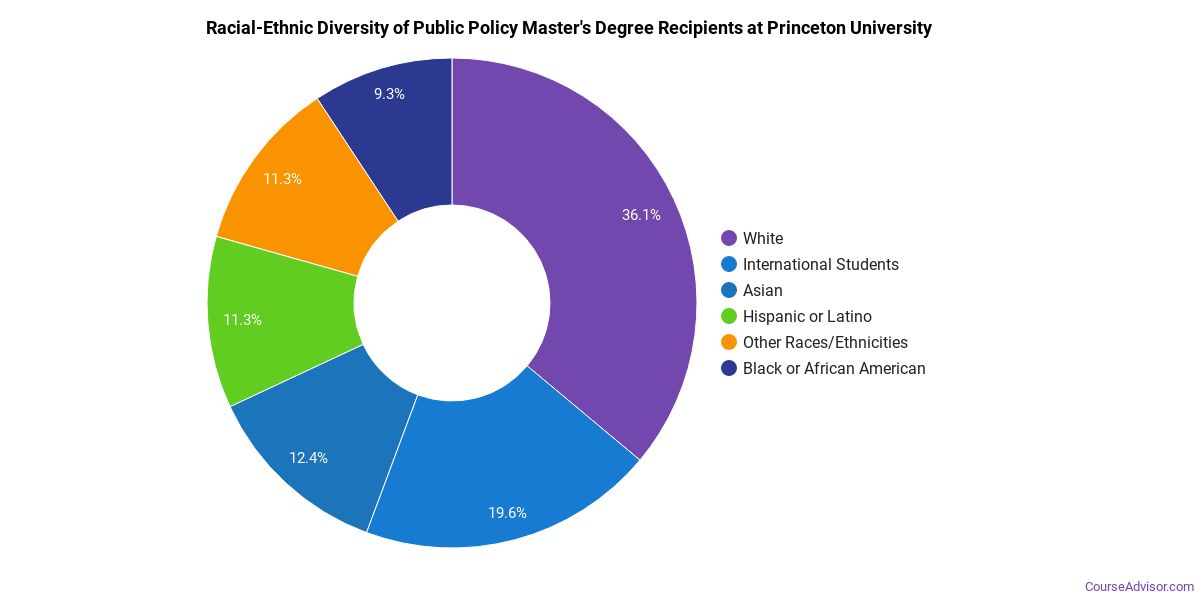
Racial-ethnic minorities make up 32% of Public Policy master’s degree recipients at Princeton University, lower than the national average of 33%.*
Public Policy Doctoral Program at Princeton University
Among the 5 doctoral public policy graduates at Princeton University, 40% were women (2) and 60% were men (3).

The following table and chart show the race/ethnicity of Public Policy doctoral degree recipients at Princeton University.
| Race / Ethnicity | Number of Graduates |
|---|---|
| White | 2 |
| Asian | 1 |
| International (Nonresident) | 2 |

Racial-ethnic minorities make up 20% of Public Policy doctoral degree recipients at Princeton University, below the national average of 31%.*
*The racial-ethnic minorities figure is the total number of graduates minus White, international (nonresident), and unknown-race graduates.
More Specific Public Policy Concentrations at Princeton University
The Public Policy program at Princeton University includes the following sub-specializations:
| Concentration | Graduates |
|---|---|
| General Public Policy Analysis | 227 |
Top-Paying Careers for Public Policy Graduates
Graduates of the Public Policy program at Princeton University pursue many career paths. The table below ranks the top-paying careers for Public Policy majors, ordered by median annual salary:
| Occupation | Nationwide Median Wage |
|---|---|
| Legislators | $167,600 |
| Medical and Health Services Managers | $129,557 |
| Education Teachers, Postsecondary | $98,329 |
| Political Scientists | $71,521 |
| Political Science Teachers, Postsecondary | $66,472 |
| Transportation Planners | $50,855 |
| Health Specialties Teachers, Postsecondary | $46,663 |
| Social Scientists and Related Workers, All Other | $42,168 |
| Social Science Research Assistants | $41,630 |
References
- IPEDS — Integrated Postsecondary Education Data System
- U.S. Department of Education — College Scorecard
- O*NET Online (Bureau of Labor Statistics)
- National Center for Education Statistics
More about our data sources and methodologies.
Course Advisor provides higher-education, college and university, degree, program, career, salary, and other helpful information to students, faculty, institutions, and other internet audiences. Presented information and data are subject to change. Inclusion on this website does not imply or represent a direct relationship with the company, school, or brand. Information, though believed correct at time of publication, may not be correct, and no warranty is provided. Contact the schools to verify any information before relying on it. Financial aid may be available for those who qualify. The displayed options may include sponsored or recommended results, not necessarily based on your preferences.
© Course Advisor – All Rights Reserved.