Public Policy at Pepperdine University
If you plan to study Public Policy, consider the program at Pepperdine University. The following information will help you decide if it is a good fit for you.
Pepperdine University is located in Malibu, CA.
For the most recent IPEDS reporting year, 27 public policy degrees were awarded at Pepperdine University.
Featured schools near , edit
Studying Online at Pepperdine University
Distance learning is available at Pepperdine University. Among 8,976 students, 2,486 (28%) were enrolled entirely in distance education and 934 (10%) took at least some classes online.
Public Policy Rankings at Pepperdine University
Use these rankings to compare Pepperdine University’s Public Policy program to other colleges that offer this major.
Master’s-Level Rankings
| Ranking | Scope | Rank |
|---|---|---|
| Best Schools (Quality) | California | #8 of 11 |
| Best Schools (Quality) | Far Western (Region) | #9 of 13 |
| Best Value | California | #11 of 11 |
| Best Value | Far Western (Region) | #13 of 13 |
| Best Schools (Quality) | Nationwide | #61 of 96 |
| Best Value | Nationwide | #94 of 95 |
Earnings for Public Policy Graduates from Pepperdine University
Those who finish Pepperdine University’s Public Policy program report the following median earnings (per the U.S. Department of Education’s College Scorecard):

| Years After Graduation | Median Earnings |
|---|---|
| 1 year | $49,825 |
| 2 years | $57,318 |
| 3 years | $71,546 |
| 4 years | $88,181 |
| 5 years | $90,495 |
How do these earnings stack up against the rest of the school? Four years after graduating, Public Policy graduates from Pepperdine University take home a median $88,181, compared with $84,035 for all Pepperdine University graduates — about 5% higher than the school-wide median.

Student Demographics & Diversity
The following sections describe the student demographics for Public Policy graduates at Pepperdine University, by degree type.
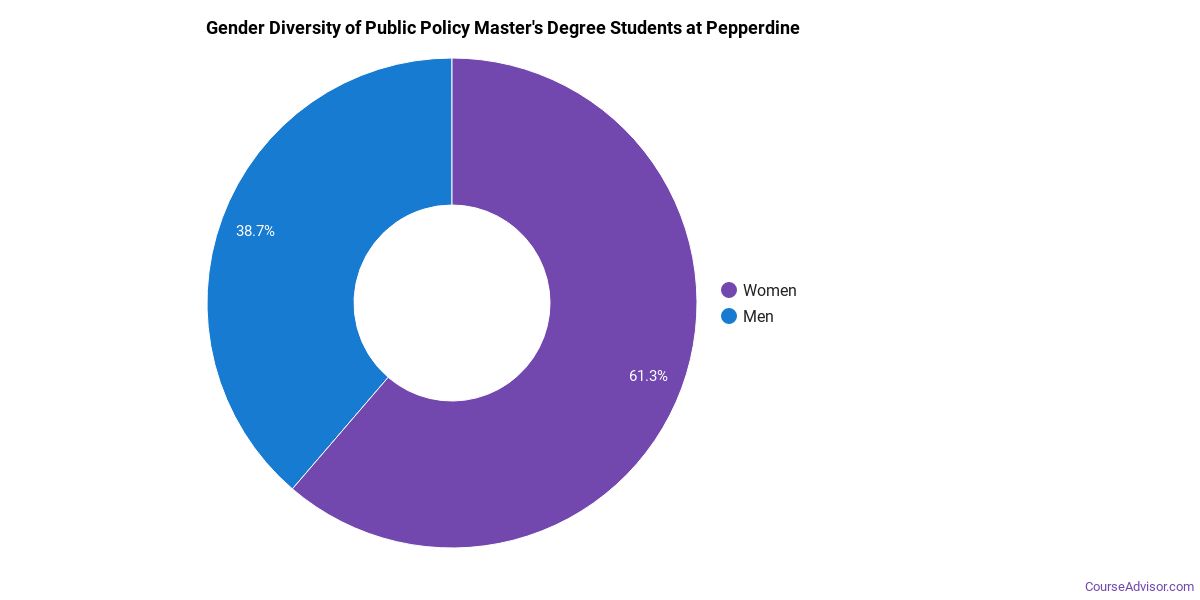
Looking at the program as a whole, Public Policy graduates at Pepperdine University are 67% women (18) and 33% men (9).
Public Policy Master’s Program at Pepperdine University
Among the 27 master’s public policy degrees awarded at Pepperdine University, 67% were women (18) and 33% were men (9).
The following table and chart show the race/ethnicity of Public Policy master’s degree recipients at Pepperdine University.
| Race / Ethnicity | Number of Graduates |
|---|---|
| White | 17 |
| Hispanic / Latino | 3 |
| Black / African American | 4 |
| International (Nonresident) | 2 |
| Unknown | 1 |
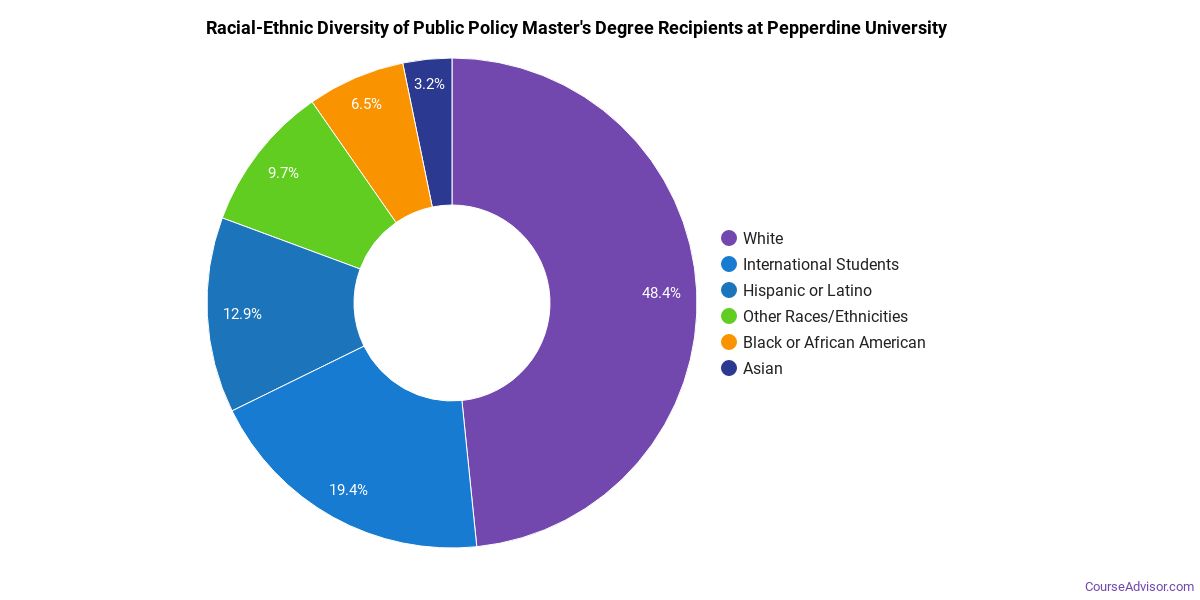
Racial-ethnic minorities make up 26% of Public Policy master’s degree recipients at Pepperdine University, below the national average of 33%.*
*The racial-ethnic minorities figure is the total number of graduates minus White, international (nonresident), and unknown-race graduates.
More Specific Public Policy Concentrations at Pepperdine University
The Public Policy program at Pepperdine University includes the following sub-specializations:
| Concentration | Graduates |
|---|---|
| General Public Policy Analysis | 27 |
Best-Paid Careers for Public Policy Graduates
Students who finish Public Policy program at Pepperdine University pursue many career paths. Here are the top-paying careers for Public Policy graduates, ordered by median annual salary:
| Occupation | Nationwide Median Wage |
|---|---|
| Legislators | $167,600 |
| Medical and Health Services Managers | $129,557 |
| Education Teachers, Postsecondary | $98,329 |
| Political Scientists | $71,521 |
| Political Science Teachers, Postsecondary | $66,472 |
| Transportation Planners | $50,855 |
| Health Specialties Teachers, Postsecondary | $46,663 |
| Social Scientists and Related Workers, All Other | $42,168 |
| Social Science Research Assistants | $41,630 |
References
- IPEDS — Integrated Postsecondary Education Data System
- U.S. Department of Education — College Scorecard
- O*NET Online (Bureau of Labor Statistics)
- National Center for Education Statistics
More about our data sources and methodologies.
Course Advisor provides higher-education, college and university, degree, program, career, salary, and other helpful information to students, faculty, institutions, and other internet audiences. Presented information and data are subject to change. Inclusion on this website does not imply or represent a direct relationship with the company, school, or brand. Information, though believed correct at time of publication, may not be correct, and no warranty is provided. Contact the schools to verify any information before relying on it. Financial aid may be available for those who qualify. The displayed options may include sponsored or recommended results, not necessarily based on your preferences.
© Course Advisor – All Rights Reserved.