Parker University Overview
Located in Dallas, Texas, Parker University is a private not-for-profit institution. The location of Parker University is great for students who prefer living in an urban area.
What Is Parker University Known For?
- Students who want to work more closely with their professors have an easier time at Parker University since the student to facuty ratio is 9 to 1.
- The student loan default rate at Parker University is 2%, which is significantly lower than the national rate of 10.1%. That's great news for students who are worrying about paying off their student loans.
- Although it may not be available for every major, the doctor's degree is the highest award a student can attain at Parker University.
- In <nil>, 60% of the faculty were full-time.
- Students who graduate from Parker University with a bachelor's degree make about $45,604 a year. That's 12% more than those who graduate from other schools.
Featured schools near , edit
Where Is Parker University?

Contact details for Parker University are given below.
| Contact Details | |
|---|---|
| Address: | 2540 Walnut Hill Lane, Dallas, TX 75229-5668 |
| Phone: | 972-438-6932 |
| Website: | www.parker.edu |
How Do I Get Into Parker University?
You can apply to Parker University online at: https://my.parker.edu/ICS/Future_Students/Apply_to_Parker_University.jnz
Can I Afford Parker University?
Student Loan Debt
While almost two-thirds of students nationwide take out loans to pay for college, the percentage may be quite different for the school you plan on attending. At Parker University, approximately 86% of students took out student loans averaging $9,194 a year. That adds up to $36,776 over four years for those students.
The student loan default rate at Parker University is 1.7%. This is significantly lower than the national default rate of 10.1%, which is a good sign that you'll be able to pay back your student loans.
Parker University Undergraduate Student Diversity

There are also 1,488 graduate students at the school.
Gender Diversity
Of the 304 full-time undergraduates at Parker University, 27% are male and 73% are female.

Racial-Ethnic Diversity
The racial-ethnic breakdown of Parker University students is as follows.

| Race/Ethnicity | Number of Grads |
|---|---|
| Asian | 18 |
| Black or African American | 87 |
| Hispanic or Latino | 25 |
| White | 120 |
| International Students | 0 |
| Other Races/Ethnicities | 54 |
Over 6 countries are represented at Parker University. The most popular countries sending students to the school are Canada, China, and Cyprus.
Online Learning at Parker University
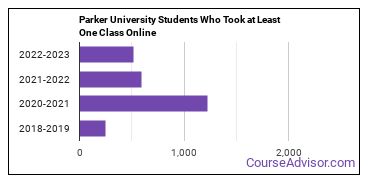
The following chart shows how the online learning population at Parker University has changed over the last few years.

This school is the 58th most popular in Texas for online learning according to the online graduations recorded by the Department of Education for the academic year 2020-2021.
Online Growth Rankings of Parker University
The average growth rate over the last four years of online students at Parker University was 81.1%. This is the #482 largest growth rate of all schools that are only partially online. This refers to all students at Parker University regardless of major.
When we speak of partially online, we are referring to schools whose online population is less than 50% of its total student body. Mostly online refers to those with online populations greater than or equal to 50%.
References
*The racial-ethnic minorities count is calculated by taking the total number of students and subtracting white students, international students, and students whose race/ethnicity was unknown. This number is then divided by the total number of students at the school to obtain the racial-ethnic minorities percentage.
- College Factual
- National Center for Education Statistics
- Image Credit: By Davidhar under License
More about our data sources and methodologies.
Featured Schools
 Request Info
|
Southern New Hampshire University You have goals. Southern New Hampshire University can help you get there. Whether you need a bachelor's degree to get into a career or want a master's degree to move up in your current career, SNHU has an online program for you. Find your degree from over 200 online programs. Learn More > |
