Ethnic Studies at Oregon State University
What traits are you looking for in a school for Ethnic Studies, you may want to check out the program at Oregon State University. The following information will help you decide if it is a good fit for you.
Oregon State University is located in Corvallis, OR.
During the most recent reporting year, 21 ethnic studies degrees were granted at Oregon State University.
Featured schools near , edit
Online Class Availability at Oregon State University
Distance learning is available at Oregon State University. Among 37,163 students, 13,083 (35%) studied exclusively online and 8,697 (23%) took at least some classes online.
Student Demographics & Diversity
Below you’ll find the diversity of Ethnic Studies graduates at Oregon State University, by degree type.
Across all degree levels, Ethnic Studies graduates at Oregon State University are 86% women (18) and 14% men (3).
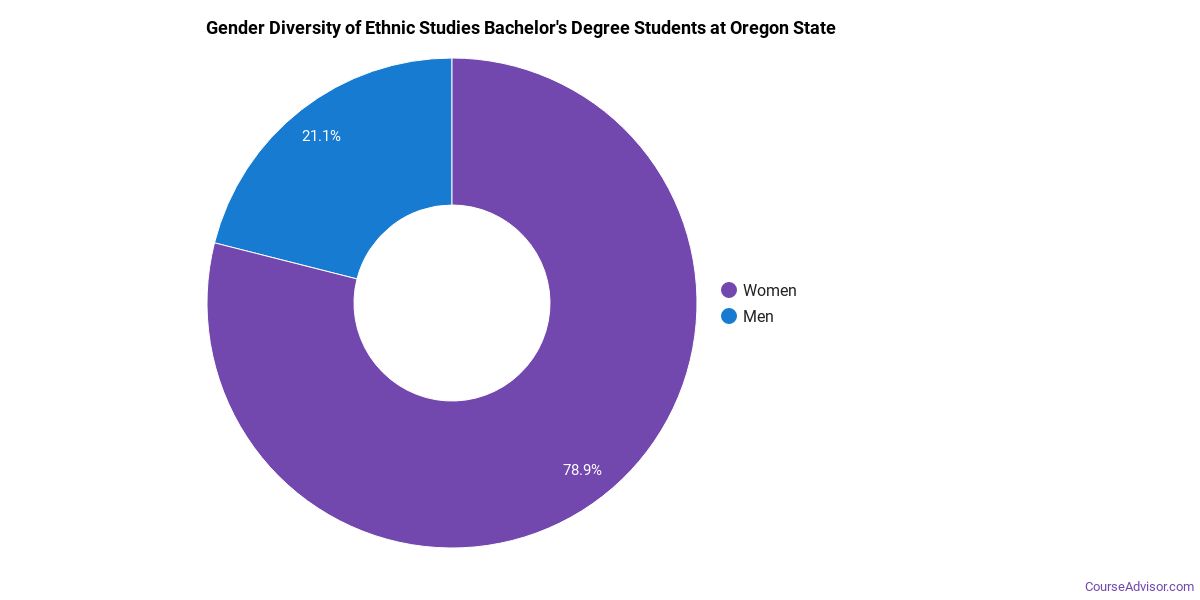
Ethnic Studies Bachelor’s Program at Oregon State University
Among the 14 bachelor’s ethnic studies degrees awarded at Oregon State University, 93% were women (13) and 7% were men (1).
The following table and chart show the race/ethnicity of Ethnic Studies bachelor’s degree recipients at Oregon State University.
| Race / Ethnicity | Number of Graduates |
|---|---|
| White | 10 |
| Hispanic / Latino | 1 |
| Black / African American | 1 |
| Asian | 1 |
| Two or More Races | 1 |
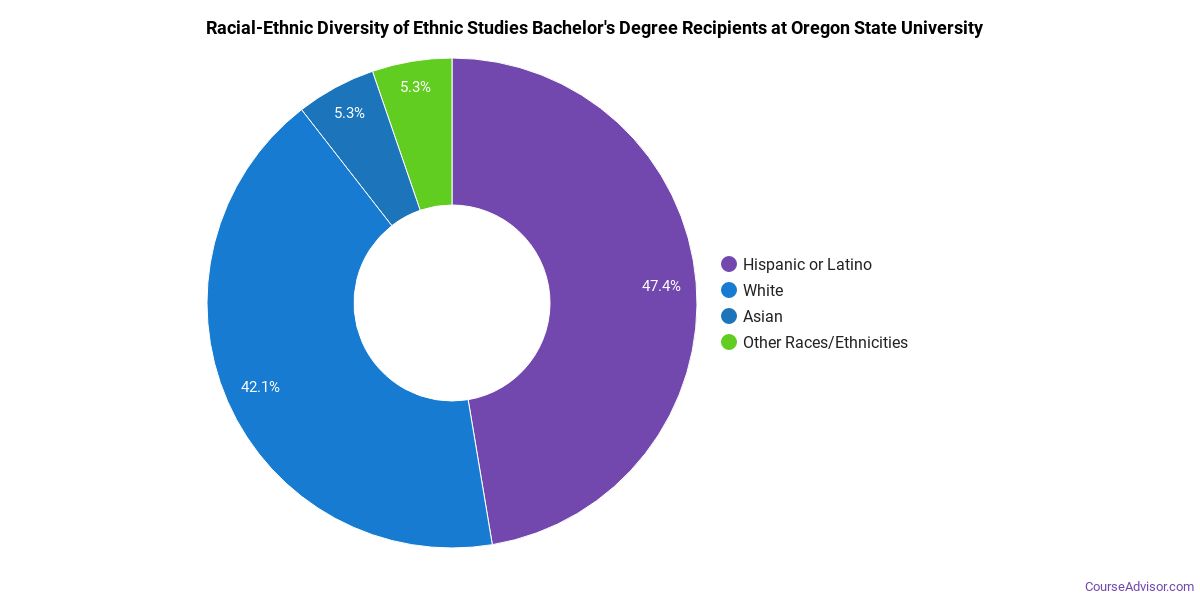
Minority students account for 29% of Ethnic Studies bachelor’s degree recipients at Oregon State University, below the national average of 66%.*
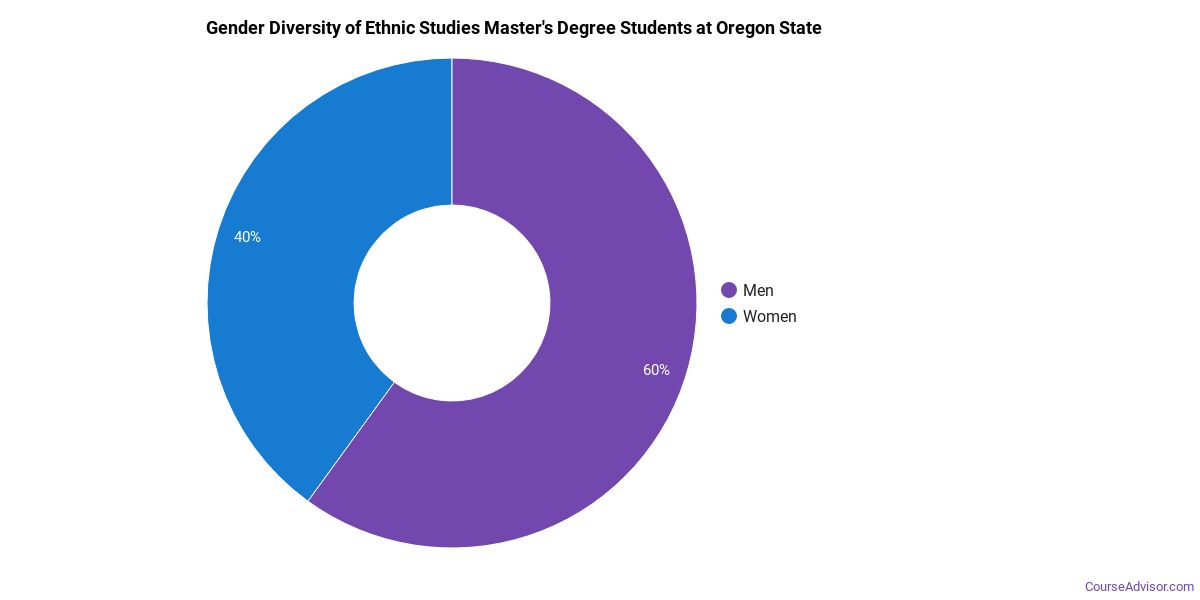
Ethnic Studies Master’s Program at Oregon State University
Of the 4 master’s ethnic studies graduates at Oregon State University, 75% were women (3) and 25% were men (1).
The following table and chart show the race/ethnicity of Ethnic Studies master’s degree recipients at Oregon State University.
| Race / Ethnicity | Number of Graduates |
|---|---|
| White | 2 |
| American Indian / Alaska Native | 2 |
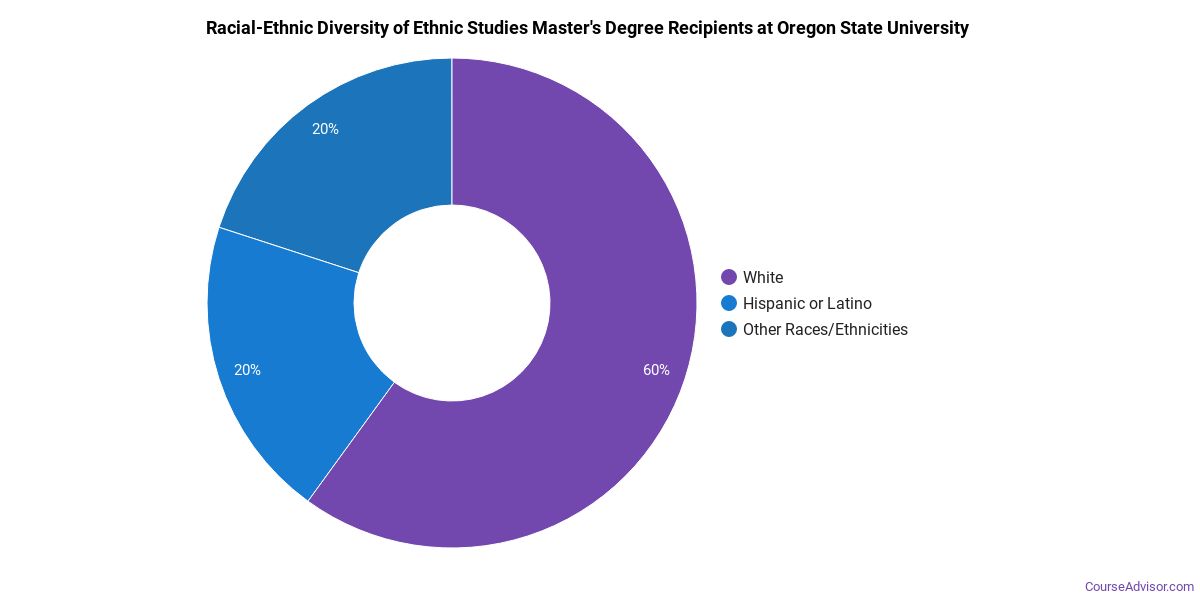
Racial-ethnic minorities make up 50% of Ethnic Studies master’s degree recipients at Oregon State University, lower than the national average of 60%.*
Ethnic Studies Doctoral Program at Oregon State University
Of the 3 doctoral ethnic studies graduates at Oregon State University, 67% were women (2) and 33% were men (1).

The following table and chart show the race/ethnicity of Ethnic Studies doctoral degree recipients at Oregon State University.
| Race / Ethnicity | Number of Graduates |
|---|---|
| White | 1 |
| Hispanic / Latino | 1 |
| Two or More Races | 1 |

Minority students account for 67% of Ethnic Studies doctoral degree recipients at Oregon State University, higher than the national average of 60%.*
*The racial-ethnic minorities figure is the total number of graduates minus White, international (nonresident), and unknown-race graduates.
More Specific Ethnic Studies Concentrations at Oregon State University
The Ethnic Studies program at Oregon State University includes the following sub-specializations:
| Concentration | Graduates |
|---|---|
| Ethnic Studies | 2 |
| Women’s Studies | 19 |
Top-Paying Careers for Ethnic Studies Graduates
Those who complete Ethnic Studies program at Oregon State University go on to a range of careers. The table below ranks the best-paid careers for Ethnic Studies majors, ordered by median annual salary:
| Occupation | Nationwide Median Wage |
|---|---|
| Interpreters and Translators | $52,627 |
| Area, Ethnic, and Cultural Studies Teachers, Postsecondary | $47,517 |
References
- IPEDS — Integrated Postsecondary Education Data System
- U.S. Department of Education — College Scorecard
- O*NET Online (Bureau of Labor Statistics)
- National Center for Education Statistics
More about our data sources and methodologies.
Course Advisor provides higher-education, college and university, degree, program, career, salary, and other helpful information to students, faculty, institutions, and other internet audiences. Presented information and data are subject to change. Inclusion on this website does not imply or represent a direct relationship with the company, school, or brand. Information, though believed correct at time of publication, may not be correct, and no warranty is provided. Contact the schools to verify any information before relying on it. Financial aid may be available for those who qualify. The displayed options may include sponsored or recommended results, not necessarily based on your preferences.
© Course Advisor – All Rights Reserved.