Liberal Arts General Studies at Ohio University-Main Campus
What traits are you looking for in a school for Liberal Arts General Studies, consider the program at Ohio University-Main Campus. We’ve gathered the following information to help you decide.
Ohio University-Main Campus is in Athens, OH.
For the most recent IPEDS reporting year, 172 liberal arts general studies graduations were recorded at Ohio University-Main Campus.
Featured schools near , edit
Studying Online at Ohio University-Main Campus
Online coursework is an option at Ohio University-Main Campus. Of 26,323 students, 6,865 (26%) were enrolled entirely in distance education and 9,651 (37%) took at least some classes online.
Liberal Arts General Studies Rankings at Ohio University-Main Campus
These rankings give you a sense of how Ohio University-Main Campus’s Liberal Arts General Studies program against other schools offering the same major.
Bachelor’s-Level Rankings
| Ranking | Scope | Rank |
|---|---|---|
| Best Schools (Quality) | Ohio | #22 of 60 |
| Best Value | Ohio | #52 of 61 |
| Best Schools (Quality) | Great Lakes (Region) | #116 of 213 |
| Best Value | Great Lakes (Region) | #196 of 215 |
| Best Schools (Quality) | Nationwide | #769 of 1,453 |
| Best Value | Nationwide | #1300 of 1,495 |
Associate-Level Rankings
| Ranking | Scope | Rank |
|---|---|---|
| Best Schools (Quality) | Ohio | #22 of 60 |
| Best Value | Ohio | #52 of 61 |
| Best Schools (Quality) | Great Lakes (Region) | #116 of 213 |
| Best Value | Great Lakes (Region) | #196 of 215 |
| Best Schools (Quality) | Nationwide | #769 of 1,453 |
| Best Value | Nationwide | #1300 of 1,495 |
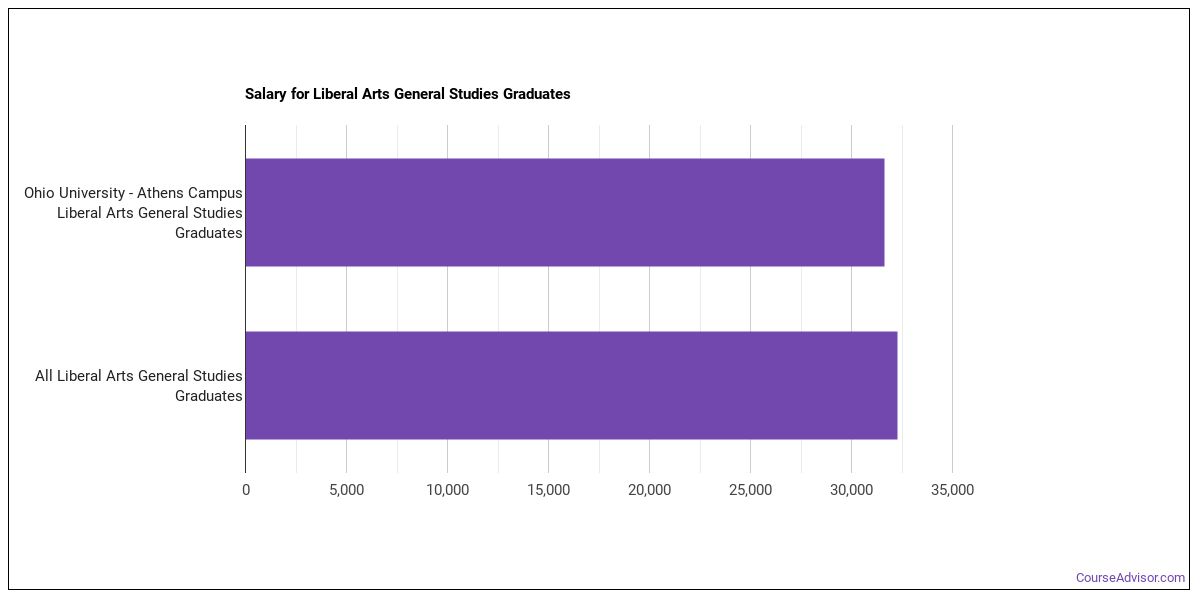
Earnings for Liberal Arts General Studies Graduates from Ohio University-Main Campus
Students who complete Ohio University-Main Campus’s Liberal Arts General Studies program earn the following amounts (per the U.S. Department of Education’s College Scorecard):
| Years After Graduation | Median Earnings |
|---|---|
| 1 year | $29,644 |
| 2 years | $26,250 |
| 3 years | $30,391 |
| 4 years | $33,335 |
| 5 years | $45,387 |
How do these earnings stack up against the rest of the school? Four years out, Liberal Arts General Studies graduates from Ohio University-Main Campus take home a median $33,335, compared with $64,618 for all Ohio University-Main Campus graduates — about 48% lower than the school-wide median.

Median Debt at Graduation
Typical debt at graduation for Liberal Arts General Studies graduates from Ohio University-Main Campus stands at $24,614.
Student Demographics & Diversity
Below you’ll find the composition of Liberal Arts General Studies graduates at Ohio University-Main Campus, by degree type.
Across all degree levels, Liberal Arts General Studies graduates at Ohio University-Main Campus are 58% women (100) and 42% men (72).
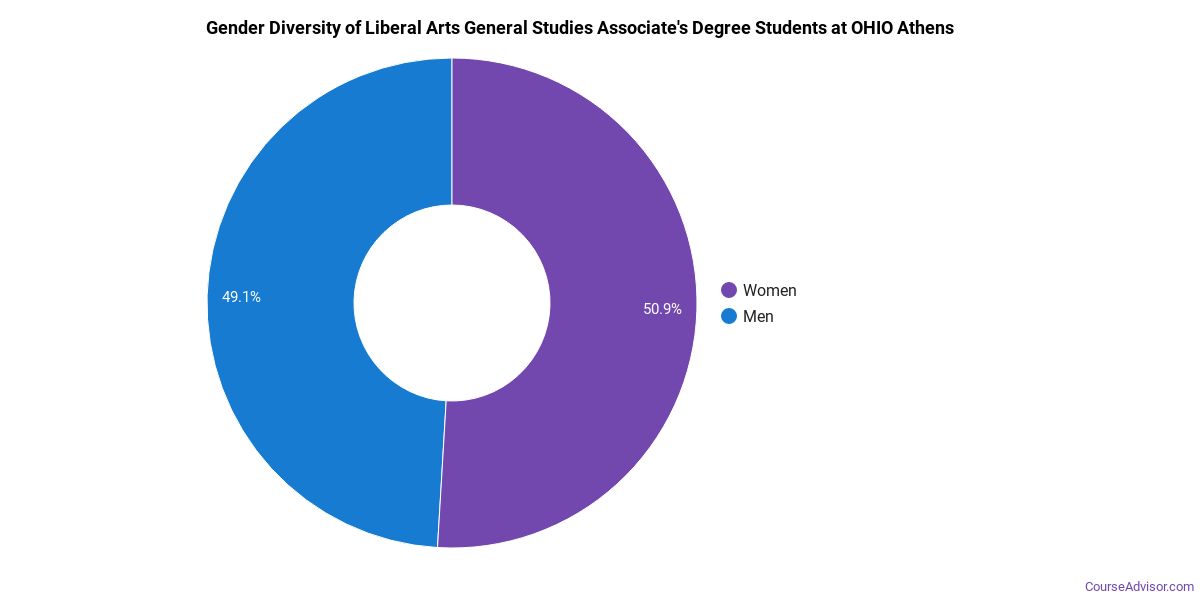
Liberal Arts General Studies Associate’s Program at Ohio University-Main Campus
Among the 131 associate’s liberal arts general studies degrees awarded at Ohio University-Main Campus, 61% were women (80) and 39% were men (51).
The following table and chart show the race/ethnicity of Liberal Arts General Studies associate’s degree recipients at Ohio University-Main Campus.
| Race / Ethnicity | Number of Graduates |
|---|---|
| White | 103 |
| Hispanic / Latino | 7 |
| Black / African American | 10 |
| Asian | 3 |
| Two or More Races | 4 |
| Unknown | 4 |
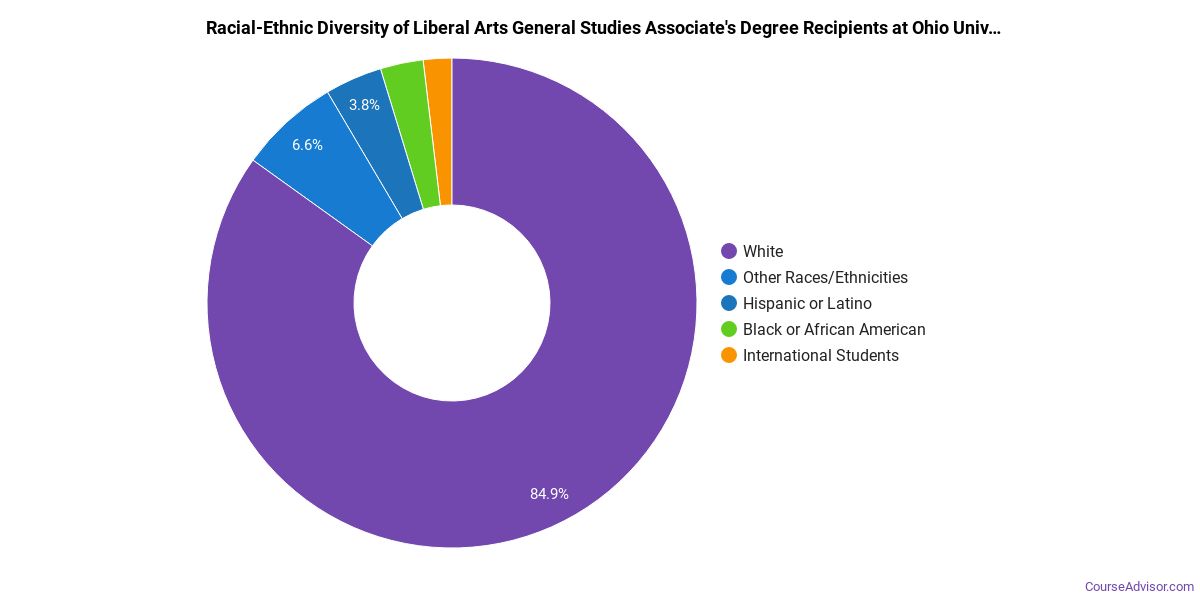
Minority students account for 18% of Liberal Arts General Studies associate’s degree recipients at Ohio University-Main Campus, lower than the national average of 49%.*
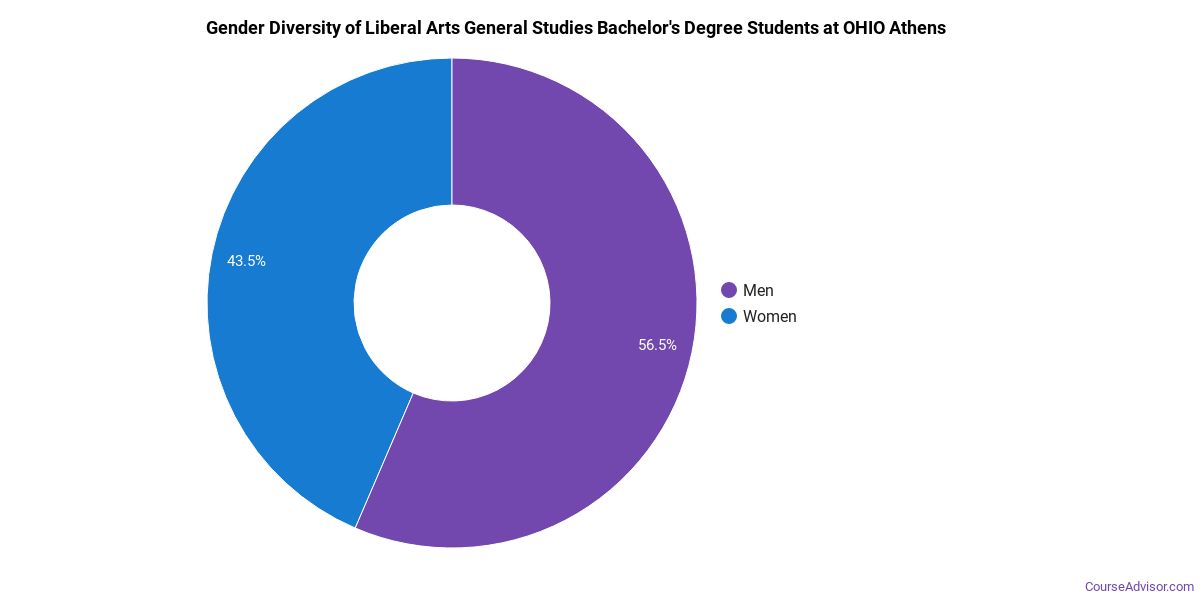
Liberal Arts General Studies Bachelor’s Program at Ohio University-Main Campus
Among the 41 bachelor’s liberal arts general studies degrees awarded at Ohio University-Main Campus, 49% were women (20) and 51% were men (21).
The following table and chart show the race/ethnicity of Liberal Arts General Studies bachelor’s degree recipients at Ohio University-Main Campus.
| Race / Ethnicity | Number of Graduates |
|---|---|
| White | 26 |
| Hispanic / Latino | 1 |
| Black / African American | 7 |
| Two or More Races | 3 |
| International (Nonresident) | 2 |
| Unknown | 2 |
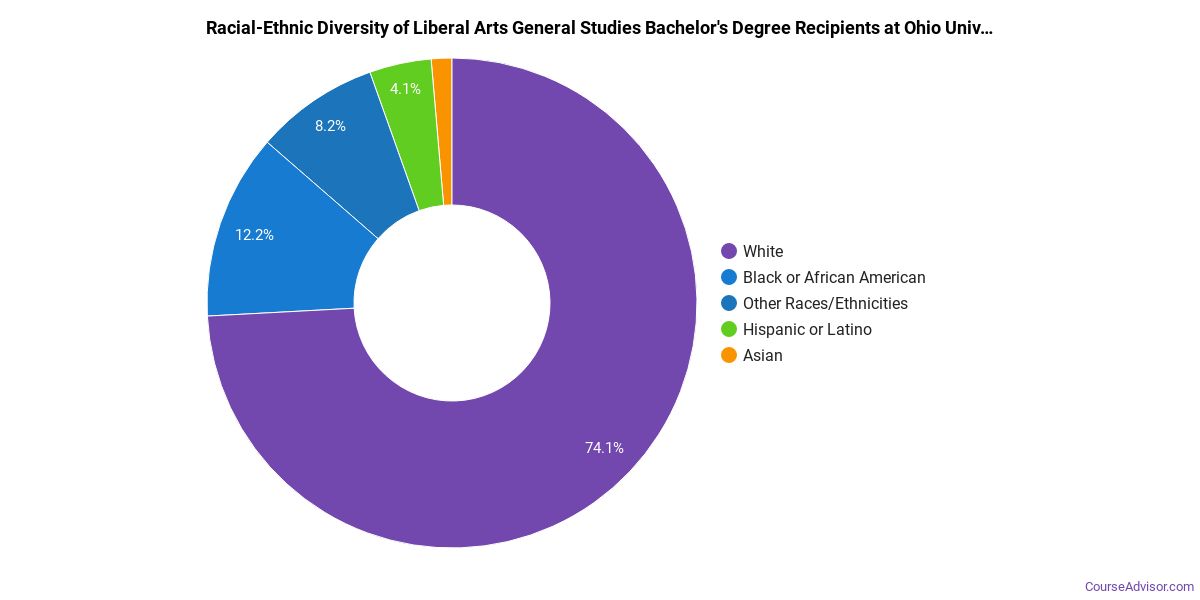
Racial-ethnic minorities make up 27% of Liberal Arts General Studies bachelor’s degree recipients at Ohio University-Main Campus, below the national average of 43%.*
*The racial-ethnic minorities figure is the total number of graduates minus White, international (nonresident), and unknown-race graduates.
More Specific Liberal Arts General Studies Concentrations at Ohio University-Main Campus
This Liberal Arts General Studies program at Ohio University-Main Campus breaks down into more specific concentrations:
| Concentration | Graduates |
|---|---|
| Liberal Arts | 100 |
| Humanities | 31 |
| Individualized Studies | 41 |
Top-Paying Careers for Liberal Arts General Studies Graduates
Those who complete Liberal Arts General Studies program at Ohio University-Main Campus go on to a range of careers. Here are the top-paying careers for Liberal Arts General Studies majors, ordered by median annual salary:
| Occupation | Nationwide Median Wage |
|---|---|
| Postsecondary Teachers, All Other | $68,967 |
References
- IPEDS — Integrated Postsecondary Education Data System
- U.S. Department of Education — College Scorecard
- O*NET Online (Bureau of Labor Statistics)
- National Center for Education Statistics
More about our data sources and methodologies.
Course Advisor provides higher-education, college and university, degree, program, career, salary, and other helpful information to students, faculty, institutions, and other internet audiences. Presented information and data are subject to change. Inclusion on this website does not imply or represent a direct relationship with the company, school, or brand. Information, though believed correct at time of publication, may not be correct, and no warranty is provided. Contact the schools to verify any information before relying on it. Financial aid may be available for those who qualify. The displayed options may include sponsored or recommended results, not necessarily based on your preferences.
© Course Advisor – All Rights Reserved.