Ethnic Studies at Ohio State University-Main Campus
If you plan to study Ethnic Studies, you may want to check out the program at Ohio State University-Main Campus. Get started with the following essential facts.
Ohio State University-Main Campus is in Columbus, OH.
In the most recent year for which we have data, 36 ethnic studies graduations were recorded at Ohio State University-Main Campus.
Featured schools near , edit
Online Class Availability at Ohio State University-Main Campus
Many students take online classes at Ohio State University-Main Campus. Among 61,443 students, 3,975 (6%) were enrolled entirely in distance education and 34,956 (57%) took at least some classes online.
Ethnic Studies Rankings at Ohio State University-Main Campus
These rankings give you a sense of how Ohio State University-Main Campus’s Ethnic Studies program to other colleges that offer this major.
Bachelor’s-Level Rankings
| Ranking | Scope | Rank |
|---|---|---|
| Best Value | Ohio | #3 of 7 |
| Best Schools (Quality) | Ohio | #4 of 7 |
| Best Schools (Quality) | Great Lakes (Region) | #15 of 22 |
| Best Value | Great Lakes (Region) | #18 of 22 |
| Best Value | Nationwide | #94 of 142 |
| Best Schools (Quality) | Nationwide | #95 of 143 |
Master’s-Level Rankings
| Ranking | Scope | Rank |
|---|---|---|
| Best Value | Ohio | #3 of 7 |
| Best Schools (Quality) | Ohio | #4 of 7 |
| Best Schools (Quality) | Great Lakes (Region) | #15 of 22 |
| Best Value | Great Lakes (Region) | #18 of 22 |
| Best Value | Nationwide | #94 of 142 |
| Best Schools (Quality) | Nationwide | #95 of 143 |
Doctoral-Level Rankings
| Ranking | Scope | Rank |
|---|---|---|
| Best Value | Ohio | #3 of 7 |
| Best Schools (Quality) | Ohio | #4 of 7 |
| Best Schools (Quality) | Great Lakes (Region) | #15 of 22 |
| Best Value | Great Lakes (Region) | #18 of 22 |
| Best Value | Nationwide | #94 of 142 |
| Best Schools (Quality) | Nationwide | #95 of 143 |
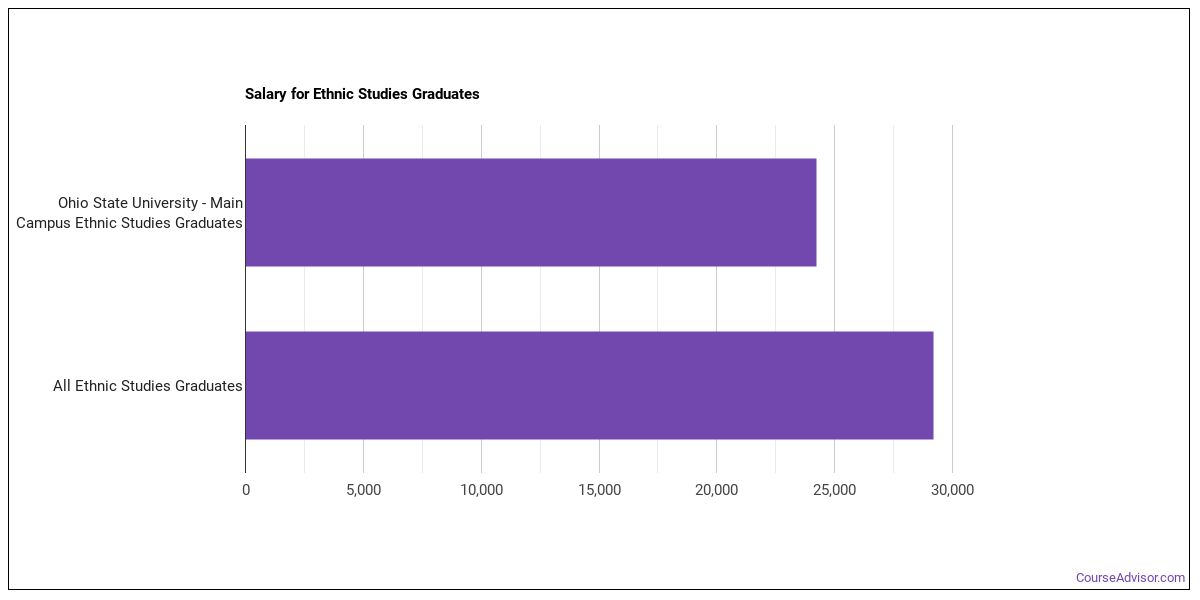
Earnings for Ethnic Studies Graduates from Ohio State University-Main Campus
Graduates of Ohio State University-Main Campus’s Ethnic Studies program report the following median earnings (per the U.S. Department of Education’s College Scorecard):
| Years After Graduation | Median Earnings |
|---|---|
| 1 year | $24,224 |
| 2 years | $27,874 |
| 3 years | $32,253 |
| 4 years | $41,029 |
| 5 years | $51,643 |
How does this compare to the school overall? At the four-year mark, Ethnic Studies graduates from Ohio State University-Main Campus report median earnings of $41,029, compared with $70,261 for all Ohio State University-Main Campus graduates — about 42% lower than the school-wide median.

Median Debt at Graduation
Typical debt at graduation for Ethnic Studies graduates from Ohio State University-Main Campus is $22,056.
Student Demographics & Diversity
Below you’ll find the student demographics for Ethnic Studies graduates at Ohio State University-Main Campus, by degree type.
Program-wide, Ethnic Studies graduates at Ohio State University-Main Campus are 78% women (28) and 22% men (8).
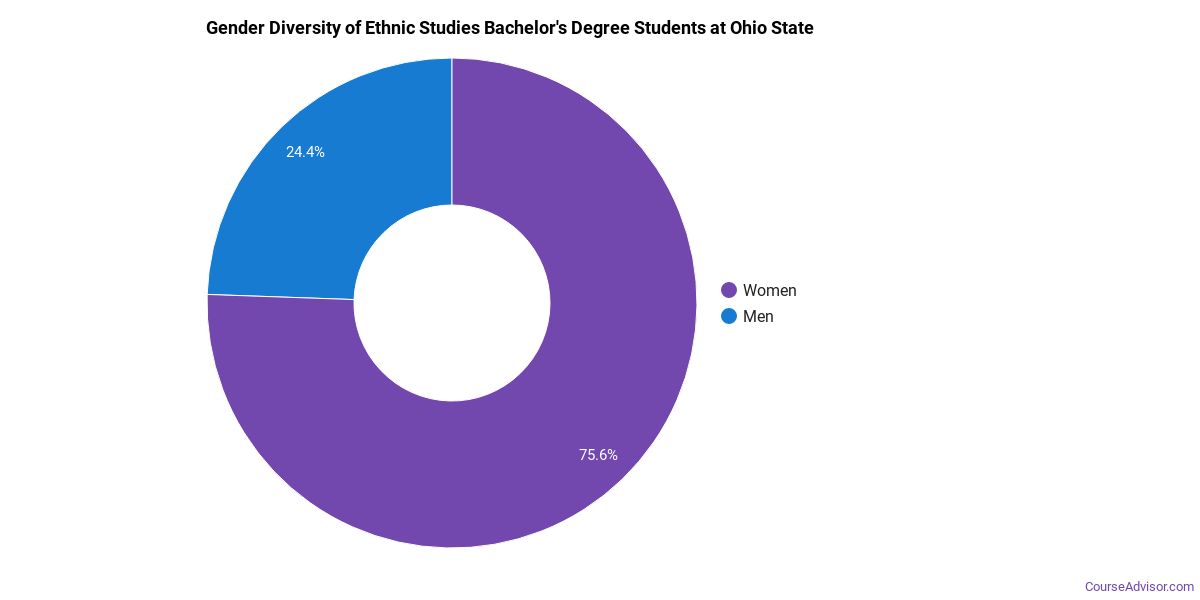
Ethnic Studies Bachelor’s Program at Ohio State University-Main Campus
Among the 29 bachelor’s ethnic studies graduates at Ohio State University-Main Campus, 83% were women (24) and 17% were men (5).
The following table and chart show the race/ethnicity of Ethnic Studies bachelor’s degree recipients at Ohio State University-Main Campus.
| Race / Ethnicity | Number of Graduates |
|---|---|
| White | 11 |
| Hispanic / Latino | 2 |
| Black / African American | 9 |
| Asian | 4 |
| Two or More Races | 3 |
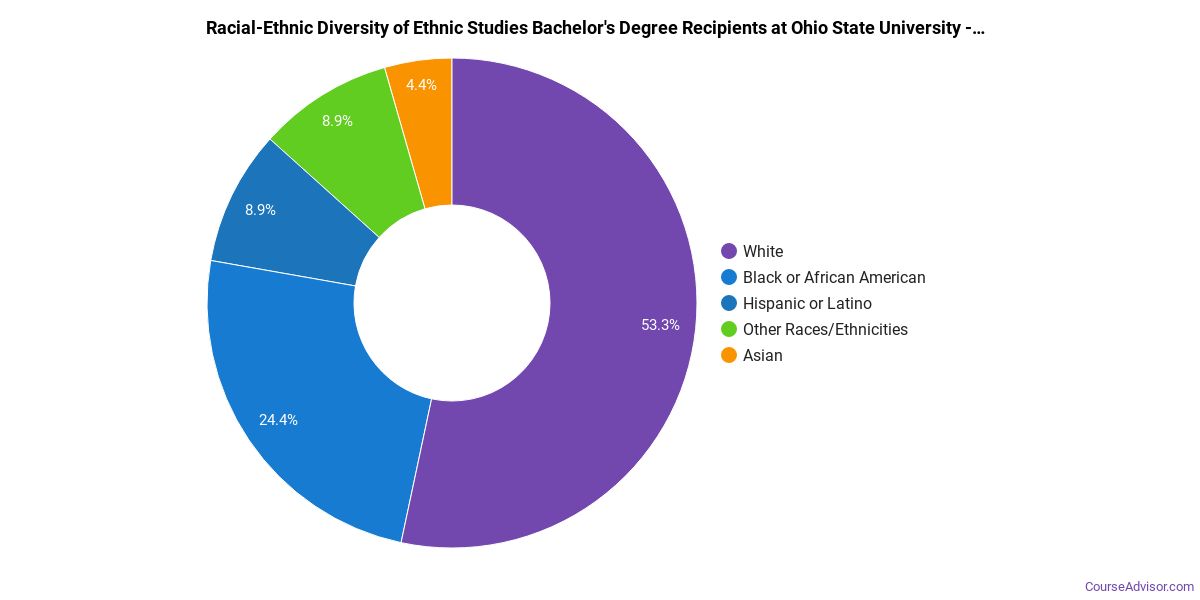
Racial-ethnic minorities make up 62% of Ethnic Studies bachelor’s degree recipients at Ohio State University-Main Campus, lower than the national average of 66%.*
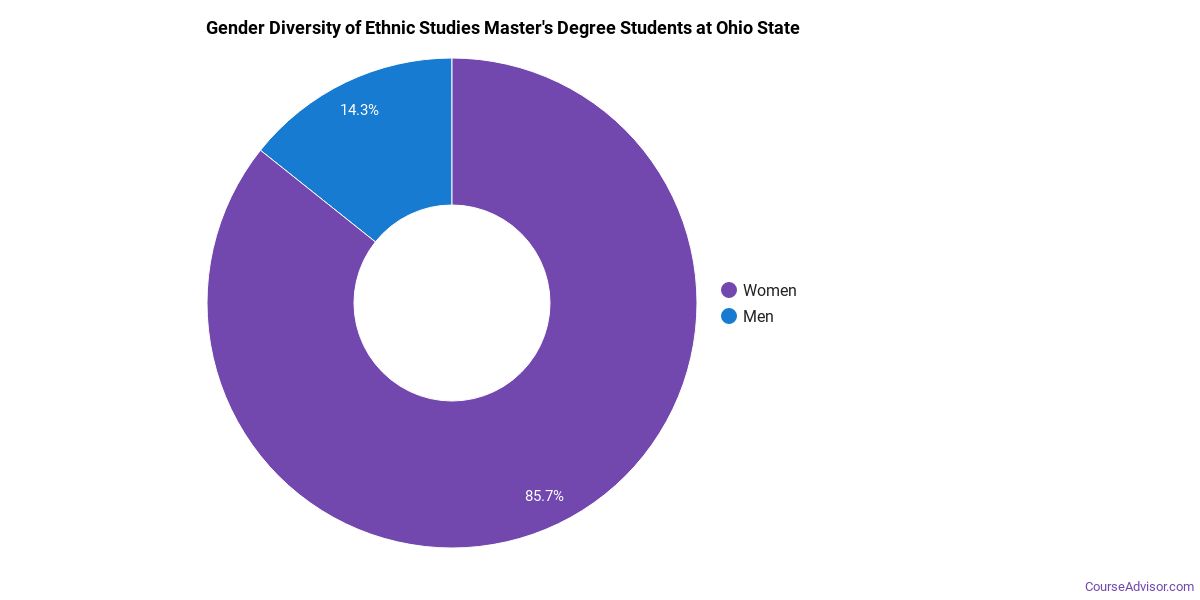
Ethnic Studies Master’s Program at Ohio State University-Main Campus
Of the 3 master’s ethnic studies degrees awarded at Ohio State University-Main Campus, 0% were women (0) and 100% were men (3).
The following table and chart show the race/ethnicity of Ethnic Studies master’s degree recipients at Ohio State University-Main Campus.
| Race / Ethnicity | Number of Graduates |
|---|---|
| White | 1 |
| Two or More Races | 1 |
| International (Nonresident) | 1 |
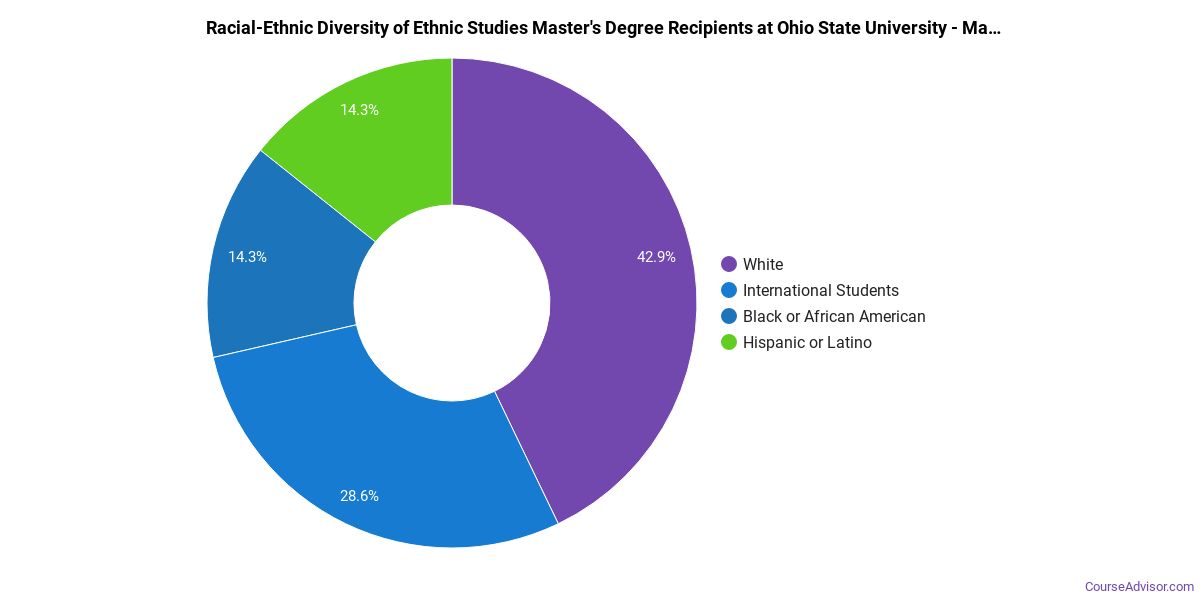
Minority students account for 33% of Ethnic Studies master’s degree recipients at Ohio State University-Main Campus, lower than the national average of 60%.*
Ethnic Studies Doctoral Program at Ohio State University-Main Campus
Of the 4 doctoral ethnic studies degrees awarded at Ohio State University-Main Campus, 100% were women (4) and 0% were men (0).

The following table and chart show the race/ethnicity of Ethnic Studies doctoral degree recipients at Ohio State University-Main Campus.
| Race / Ethnicity | Number of Graduates |
|---|---|
| White | 2 |
| Asian | 1 |
| International (Nonresident) | 1 |

Racial-ethnic minorities make up 25% of Ethnic Studies doctoral degree recipients at Ohio State University-Main Campus, lower than the national average of 60%.*
*The racial-ethnic minorities figure is the total number of graduates minus White, international (nonresident), and unknown-race graduates.
More Specific Ethnic Studies Concentrations at Ohio State University-Main Campus
The Ethnic Studies program at Ohio State University-Main Campus offers more specialized concentrations:
| Concentration | Graduates |
|---|---|
| African American Studies | 13 |
| Women’s Studies | 23 |
Top-Paying Careers for Ethnic Studies Graduates
Graduates of the Ethnic Studies program at Ohio State University-Main Campus go on to a range of careers. The table below ranks the top-paying careers for Ethnic Studies graduates, ordered by median annual salary:
| Occupation | Nationwide Median Wage |
|---|---|
| Interpreters and Translators | $52,627 |
| Area, Ethnic, and Cultural Studies Teachers, Postsecondary | $47,517 |
References
- IPEDS — Integrated Postsecondary Education Data System
- U.S. Department of Education — College Scorecard
- O*NET Online (Bureau of Labor Statistics)
- National Center for Education Statistics
More about our data sources and methodologies.
Course Advisor provides higher-education, college and university, degree, program, career, salary, and other helpful information to students, faculty, institutions, and other internet audiences. Presented information and data are subject to change. Inclusion on this website does not imply or represent a direct relationship with the company, school, or brand. Information, though believed correct at time of publication, may not be correct, and no warranty is provided. Contact the schools to verify any information before relying on it. Financial aid may be available for those who qualify. The displayed options may include sponsored or recommended results, not necessarily based on your preferences.
© Course Advisor – All Rights Reserved.