Notre Dame de Namur University Science & Tech Programs
Notre Dame de Namur University is a private not-for-profit institution located in Belmont, CA. The Suburbs Of A Large City offers a peaceful environment close to urban amenities.
Featured schools near , edit
Notre Dame de Namur University Rankings
NDNU is featured in these rankings for science & tech programs at the bachelors level:
| Ranking | Rank | Among |
|---|---|---|
| Overall Quality | #147 of 469 | State — California |
| Overall Quality | #212 of 667 | Region — Far Western |
| Overall Quality | #1299 of 4,630 | Nationwide |
Where Is Notre Dame de Namur University?
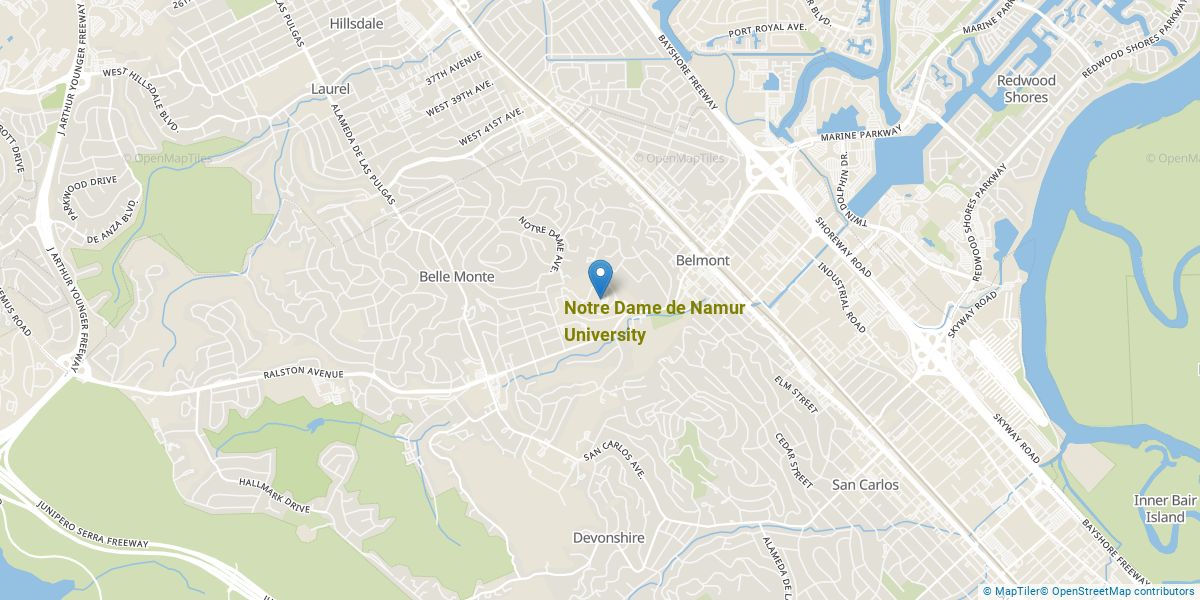
Get in touch with NDNU can be found below.
| Contact Details | |
|---|---|
| Address: | 1500 Ralston Ave, Belmont, CA 94002-1908 |
| Phone: | 6505083500 |
| Website: | www.ndnu.edu/ |
| Admissions: | www.ndnu.edu/admissions/ |
| Financial Aid: | www.ndnu.edu/financial-aid/ |
How Do I Get Into NDNU?
You can apply to NDNU online at: www.ndnu.edu/apply/
How Hard Is It To Get Into NDNU?
Average Test Scores
Can I Afford Notre Dame de Namur University?
The average net price after aid at NDNU is $16,772. Cost varies significantly based on your financial situation since net price varies by income group.
Tuition & Fees
| Category | Cost |
|---|---|
| In-State Tuition | $15,792 |
| In-State Fees | $N/A |
| Out-of-State Tuition | $15,792 |
| Out-of-State Fees | $N/A |
| Total In-State Tuition & Fees | $15,792 |
| Total Out-of-State Tuition & Fees | $15,792 |
Financial Aid
Nearly 93% of students at NDNU receive grant or scholarship aid, averaging $9,442 per student.
29% of students receive federal Pell Grants, averaging $4,262.
Student Loan Debt
21% of NDNU undergraduates take out federal student loans, averaging $7,357 per year.
Notre Dame de Namur University Undergraduate Student Diversity
There are 246 students enrolled at NDNU, including 14 undergraduate and 223 graduate students. NDNU is classified as a Under 1,000 institution by enrollment size. Its Carnegie Classification is Master’s Colleges & Universities: Medium Programs.
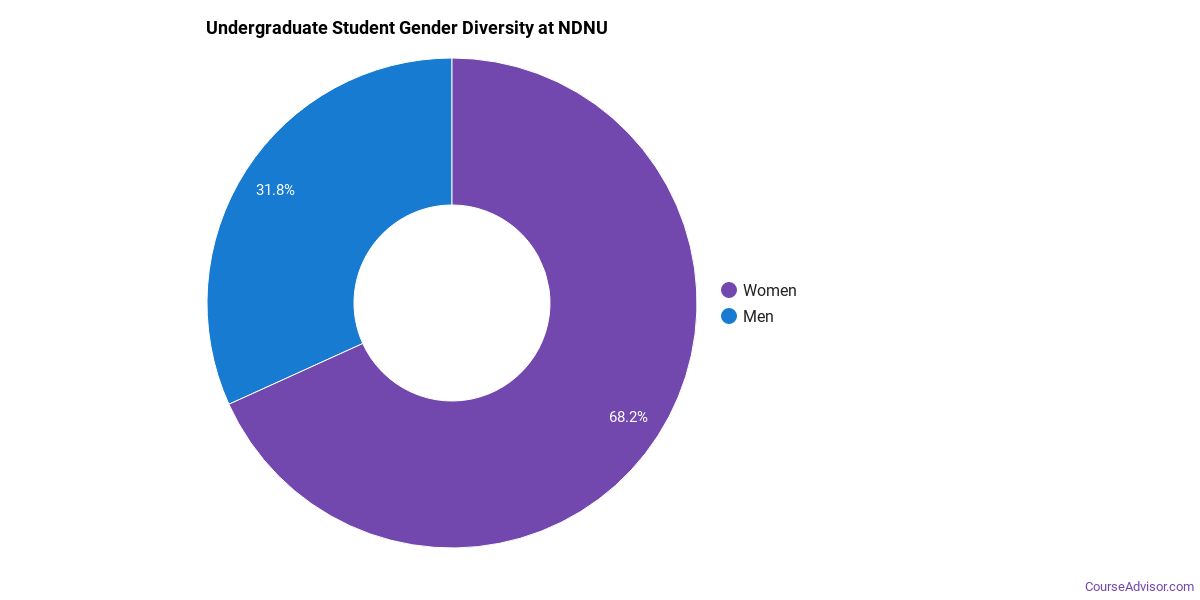
Gender Diversity
Of the 14 undergraduate students at NDNU, approximately 24% are male and 76% are female.
Racial-Ethnic Diversity
The racial-ethnic breakdown of Notre Dame de Namur University undergraduate students is as follows.
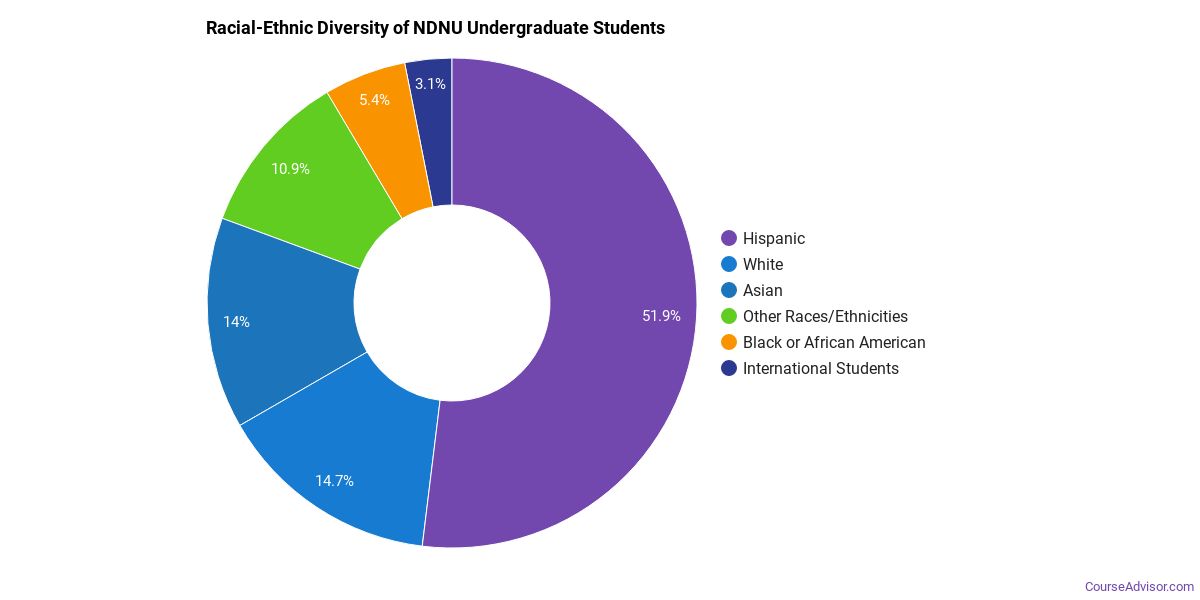
| Race/Ethnicity | Number of Students |
|---|---|
| Asian | 0 |
| Black or African American | 0 |
| Hispanic | 6 |
| White | 2 |
| Two or More Races | 0 |
| Non-Resident | 0 |
Geographic Diversity
Of the 14 undergraduate students at NDNU, approximately 3.0% are non-resident students from outside the United States (1 students total across all levels).
Notre Dame de Namur University Graduate Student Diversity
223 of NDNU’s students are in graduate programs. The highest graduate-level award offered is Master’s degree.
Gender Diversity (Graduate)
Among graduate students at NDNU, approximately 22% are male and 78% are female.

Racial-Ethnic Diversity (Graduate)
The racial-ethnic breakdown of Notre Dame de Namur University graduate students is as follows.

| Race/Ethnicity | Number of Students |
|---|---|
| Asian | 34 |
| Black or African American | 9 |
| Hispanic | 56 |
| White | 91 |
| American Indian/Alaska Native | 0 |
| Native Hawaiian/Pacific Islander | 1 |
| Two or More Races | 3 |
| Non-Resident | 9 |
Online Learning at Notre Dame de Namur University
NDNU offers remote learning paths for students who need flexibility.
At the graduate level, 140 students took at least one online class and 56 took all classes online. Distance education is available at the undergraduate and graduate levels.
Academic Programs at Notre Dame de Namur University
NDNU offers 5 distinct academic programs.
The highest level of award offered is Master’s degree.
Institutional Profile
NDNU has an open admission policy: Not applicable. Credit transfer:
- AP credits: Yes
- Dual enrollment credits: Yes
- Life experience credits: Implied no
References
More about our data sources and methodologies.
Course Advisor provides higher-education, college and university, degree, program, career, salary, and other helpful information to students, faculty, institutions, and other internet audiences. Presented information and data are subject to change. Inclusion on this website does not imply or represent a direct relationship with the company, school, or brand. Information, though believed correct at time of publication, may not be correct, and no warranty is provided. Contact the schools to verify any information before relying on it. Financial aid may be available for those who qualify. The displayed options may include sponsored or recommended results, not necessarily based on your preferences.
© Course Advisor – All Rights Reserved.