Ethnic Studies at Northwestern University
What traits are you looking for in a school for Ethnic Studies, take a look at what Northwestern University. Get started with the following essential facts.
Northwestern University is in Evanston, IL.
For the most recent IPEDS reporting year, 32 ethnic studies degrees were awarded at Northwestern University.
Featured schools near , edit
Studying Online at Northwestern University
Online coursework is an option at Northwestern University. Of 23,856 students, 781 (3%) studied exclusively online and 1,509 (6%) took at least some classes online.
Student Demographics & Diversity
Below you’ll find the composition of Ethnic Studies graduates at Northwestern University, broken down by degree level.
Program-wide, Ethnic Studies graduates at Northwestern University are 75% women (24) and 25% men (8).
Ethnic Studies Bachelor’s Program at Northwestern University
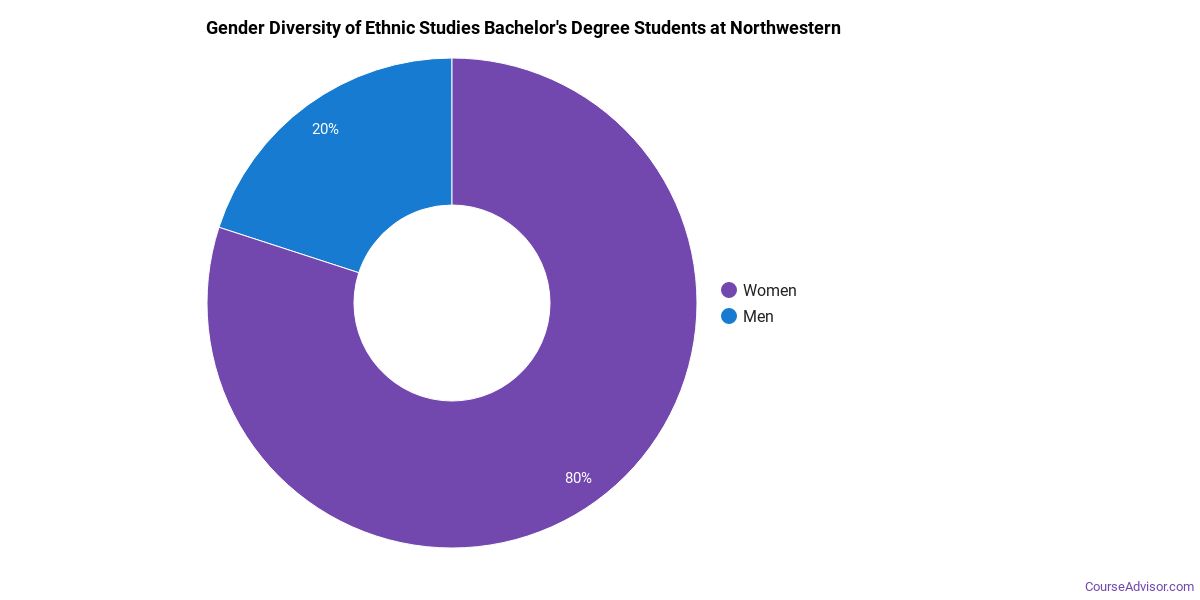
Among the 17 bachelor’s ethnic studies graduates at Northwestern University, 71% were women (12) and 29% were men (5).
The following table and chart show the race/ethnicity of Ethnic Studies bachelor’s degree recipients at Northwestern University.
| Race / Ethnicity | Number of Graduates |
|---|---|
| White | 3 |
| Hispanic / Latino | 6 |
| Asian | 4 |
| Two or More Races | 2 |
| International (Nonresident) | 1 |
| Unknown | 1 |
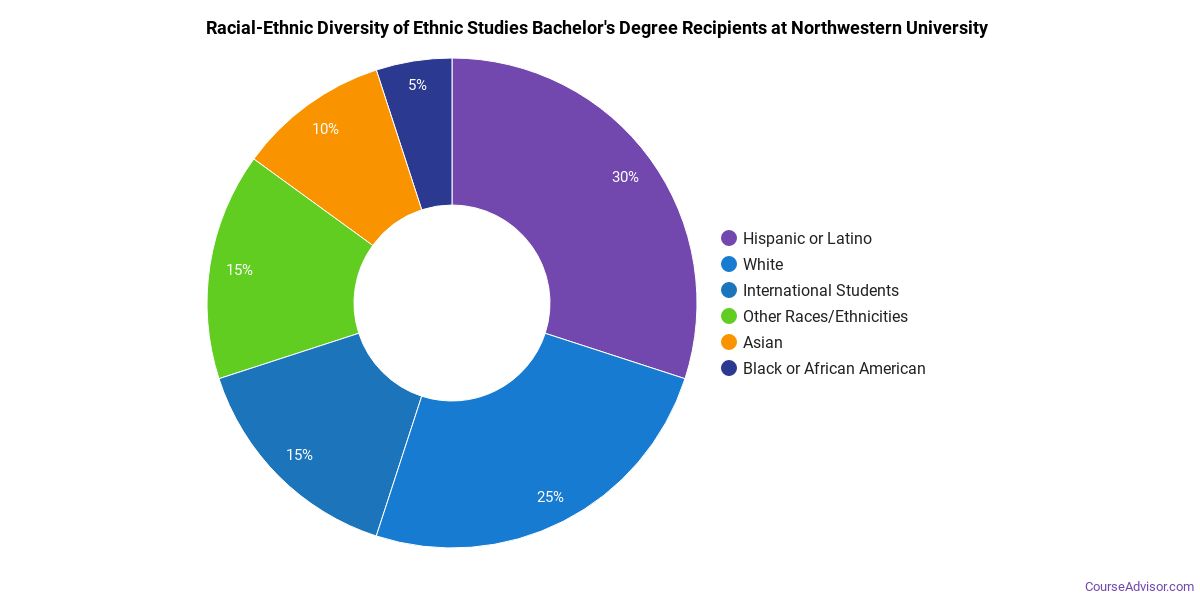
Racial-ethnic minorities make up 71% of Ethnic Studies bachelor’s degree recipients at Northwestern University, higher than the national average of 66%.*
Ethnic Studies Master’s Program at Northwestern University
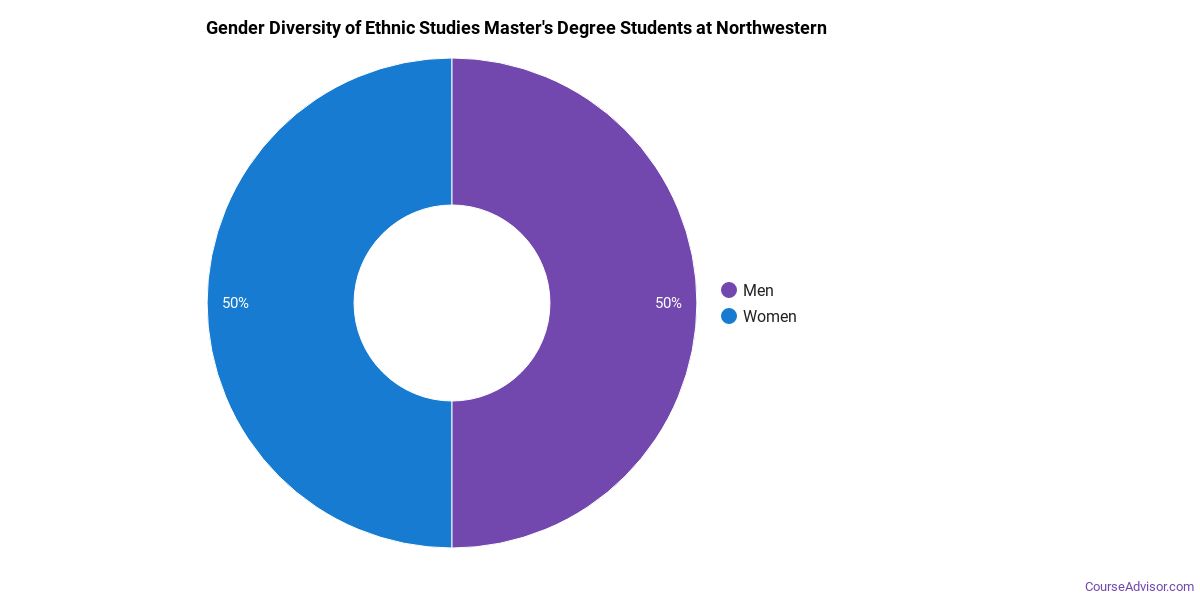
Among the 3 master’s ethnic studies graduates at Northwestern University, 67% were women (2) and 33% were men (1).
The following table and chart show the race/ethnicity of Ethnic Studies master’s degree recipients at Northwestern University.
| Race / Ethnicity | Number of Graduates |
|---|---|
| Black / African American | 3 |
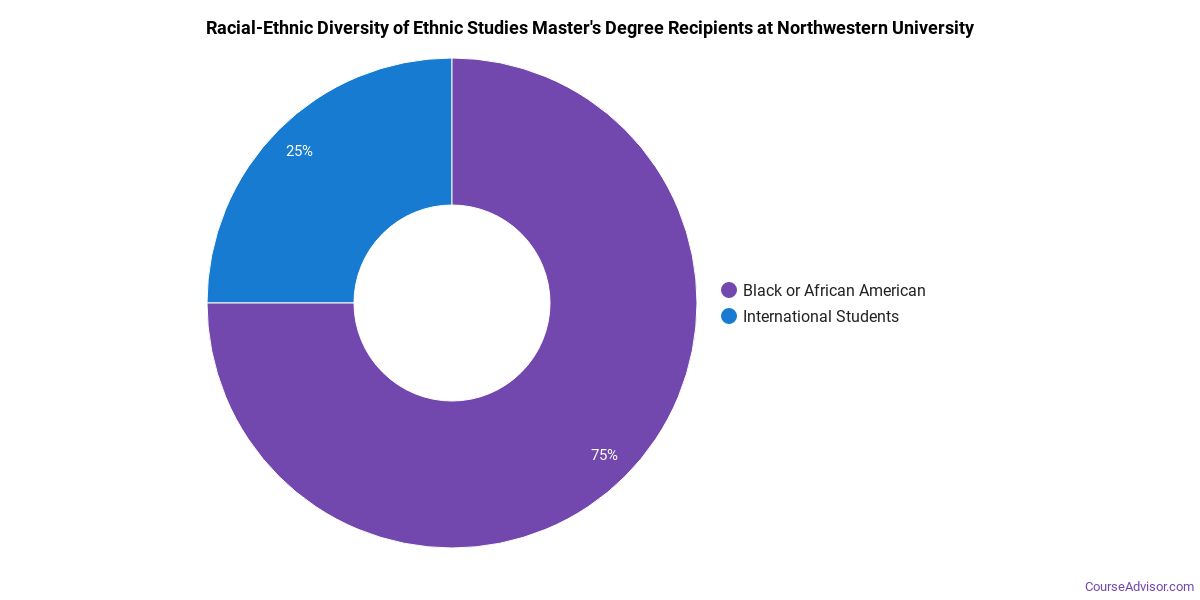
Minority students account for 100% of Ethnic Studies master’s degree recipients at Northwestern University, higher than the national average of 60%.*
Ethnic Studies Doctoral Program at Northwestern University
Of the 4 doctoral ethnic studies graduates at Northwestern University, 75% were women (3) and 25% were men (1).

The following table and chart show the race/ethnicity of Ethnic Studies doctoral degree recipients at Northwestern University.
| Race / Ethnicity | Number of Graduates |
|---|---|
| Hispanic / Latino | 1 |
| Black / African American | 2 |
| Two or More Races | 1 |

Racial-ethnic minorities make up 100% of Ethnic Studies doctoral degree recipients at Northwestern University, higher than the national average of 60%.*
*The racial-ethnic minorities figure is the total number of graduates minus White, international (nonresident), and unknown-race graduates.
More Specific Ethnic Studies Concentrations at Northwestern University
This Ethnic Studies program at Northwestern University offers more specialized concentrations:
| Concentration | Graduates |
|---|---|
| African American Studies | 12 |
| Latino Studies | 4 |
| Asian-American Studies | 3 |
| Women’s Studies | 5 |
| Other Ethnic Studies | 8 |
Best-Paid Careers for Ethnic Studies Graduates
Those who complete Ethnic Studies program at Northwestern University work across a variety of fields. The table below ranks the best-paid careers for Ethnic Studies graduates, ordered by median annual salary:
| Occupation | Nationwide Median Wage |
|---|---|
| Interpreters and Translators | $52,627 |
| Area, Ethnic, and Cultural Studies Teachers, Postsecondary | $47,517 |
References
- IPEDS — Integrated Postsecondary Education Data System
- U.S. Department of Education — College Scorecard
- O*NET Online (Bureau of Labor Statistics)
- National Center for Education Statistics
More about our data sources and methodologies.
Course Advisor provides higher-education, college and university, degree, program, career, salary, and other helpful information to students, faculty, institutions, and other internet audiences. Presented information and data are subject to change. Inclusion on this website does not imply or represent a direct relationship with the company, school, or brand. Information, though believed correct at time of publication, may not be correct, and no warranty is provided. Contact the schools to verify any information before relying on it. Financial aid may be available for those who qualify. The displayed options may include sponsored or recommended results, not necessarily based on your preferences.
© Course Advisor – All Rights Reserved.