Other Visual Art at Northeastern University
If you plan to study Other Visual Art, you may want to check out the program at Northeastern University. The following information will help you decide if it is a good fit for you.
Northeastern University is located in Boston, MA.
In the most recent year for which we have data, 1 other visual art degrees were granted at Northeastern University.
Featured schools near , edit
Online & Distance Learning at Northeastern University
Many students take online classes at Northeastern University. Of 32,553 students, 1,730 (5%) were enrolled entirely in distance education and 7,507 (23%) took at least some classes online.
Other Visual Art Rankings at Northeastern University
Rankings can help you compare Northeastern University’s Other Visual Art program against peer institutions.
Student Demographics & Diversity
The following sections describe the student demographics for Other Visual Art graduates at Northeastern University, by degree type.
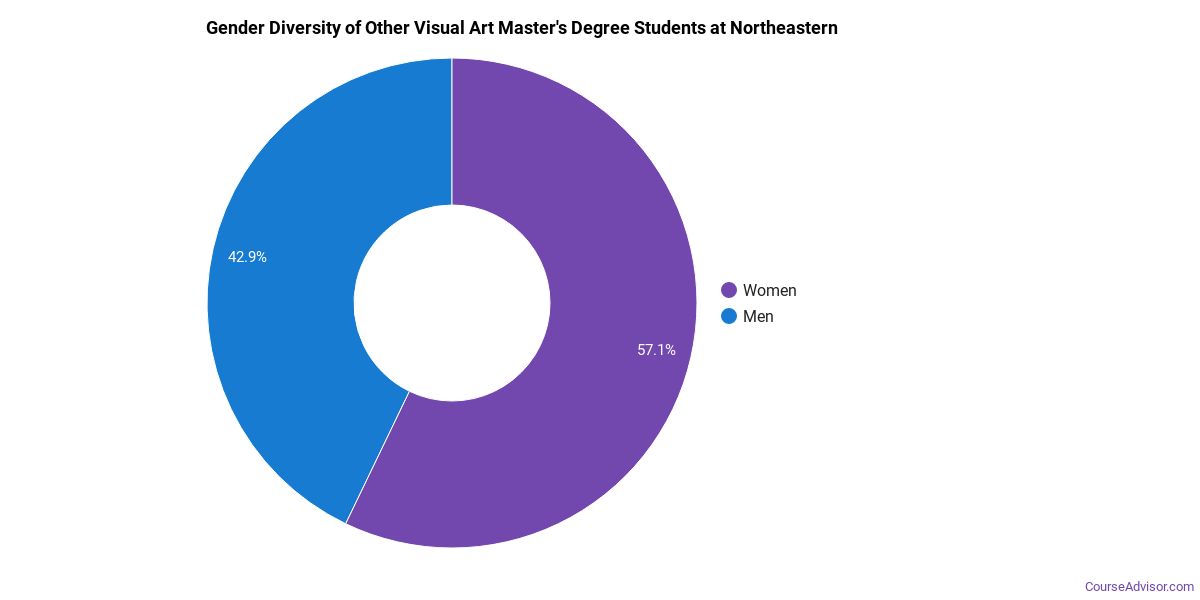
Looking at the program as a whole, Other Visual Art graduates at Northeastern University are 100% women (1) and 0% men (0).
Other Visual Art Master’s Program at Northeastern University
Among the 1 master’s other visual art degrees awarded at Northeastern University, 100% were women (1) and 0% were men (0).
The following table and chart show the race/ethnicity of Other Visual Art master’s degree recipients at Northeastern University.
| Race / Ethnicity | Number of Graduates |
|---|---|
| International (Nonresident) | 1 |
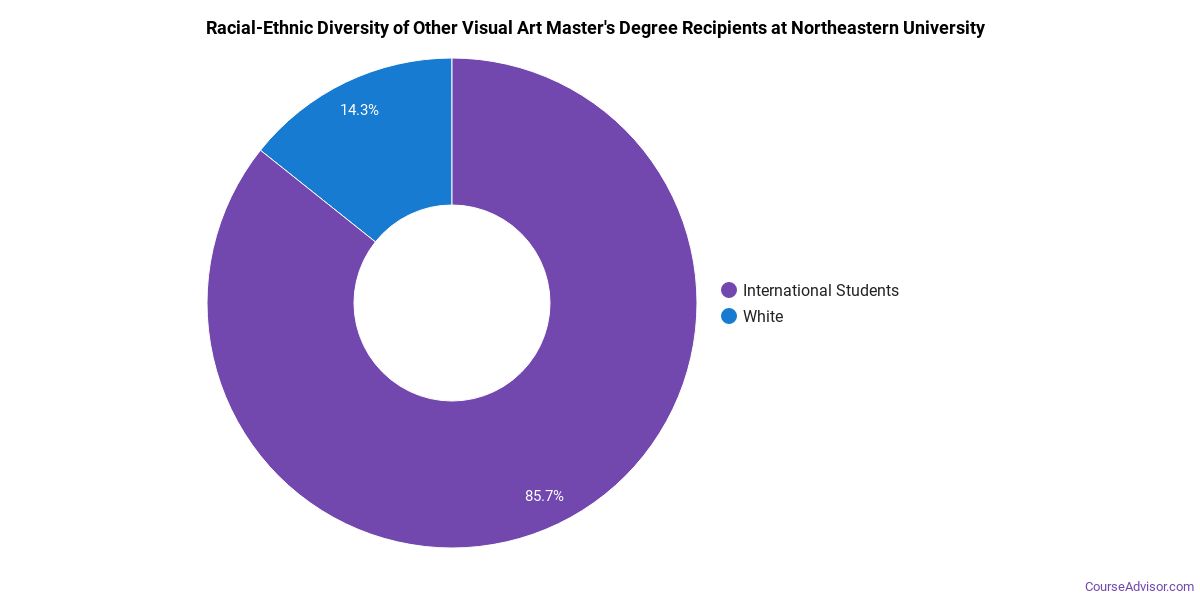
*The racial-ethnic minorities figure is the total number of graduates minus White, international (nonresident), and unknown-race graduates.
More Specific Other Visual Art Concentrations at Northeastern University
This Other Visual Art program at Northeastern University breaks down into more specific concentrations:
| Concentration | Graduates |
|---|---|
| Other Visual & Performing Arts | 1 |
Best-Paid Careers for Other Visual Art Graduates
Those who complete Other Visual Art program at Northeastern University go on to a range of careers. Here are the best-paid careers for Other Visual Art majors, ordered by median annual salary:
| Occupation | Nationwide Median Wage |
|---|---|
| Art, Drama, and Music Teachers, Postsecondary | $46,983 |
References
- IPEDS — Integrated Postsecondary Education Data System
- U.S. Department of Education — College Scorecard
- O*NET Online (Bureau of Labor Statistics)
- National Center for Education Statistics
More about our data sources and methodologies.
Course Advisor provides higher-education, college and university, degree, program, career, salary, and other helpful information to students, faculty, institutions, and other internet audiences. Presented information and data are subject to change. Inclusion on this website does not imply or represent a direct relationship with the company, school, or brand. Information, though believed correct at time of publication, may not be correct, and no warranty is provided. Contact the schools to verify any information before relying on it. Financial aid may be available for those who qualify. The displayed options may include sponsored or recommended results, not necessarily based on your preferences.
© Course Advisor – All Rights Reserved.