Teacher Education Grade Specific at Newman University
If you are interested in studying Teacher Education Grade Specific, consider the program at Newman University. The following information will help you decide if it is a good fit for you.
Newman University sits in Wichita, KS.
During the most recent reporting year, 52 teacher education grade specific degrees were awarded at Newman University.
Featured schools near , edit
Studying Online at Newman University
Online coursework is an option at Newman University. Of 2,939 students, 300 (10%) were enrolled entirely in distance education and 589 (20%) took at least some classes online.
Teacher Education Grade Specific Rankings at Newman University
Use these rankings to compare Newman University’s Teacher Education Grade Specific program to other colleges that offer this major.
Bachelor’s-Level Rankings
| Ranking | Scope | Rank |
|---|---|---|
| Best Schools (Quality) | Kansas | #7 of 15 |
| Best Value | Kansas | #10 of 14 |
| Best Schools (Quality) | The Plains States (Region) | #67 of 137 |
| Best Value | The Plains States (Region) | #76 of 135 |
| Best Schools (Quality) | Nationwide | #636 of 1,231 |
| Best Value | Nationwide | #790 of 1,224 |
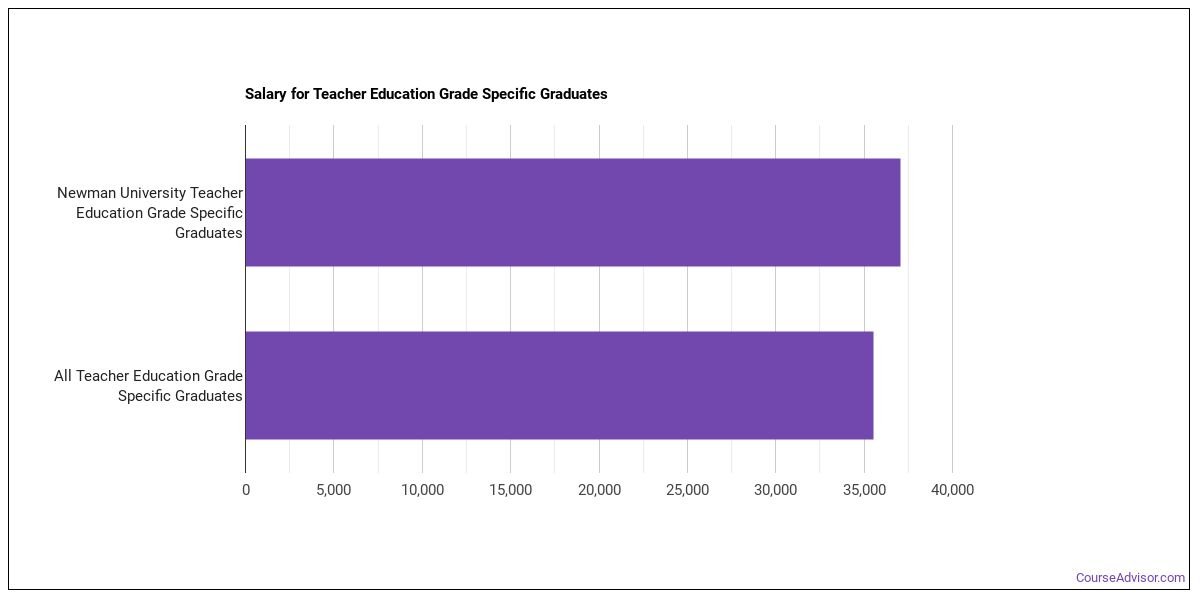
Earnings for Teacher Education Grade Specific Graduates from Newman University
Students who complete Newman University’s Teacher Education Grade Specific program earn the following amounts (per the U.S. Department of Education’s College Scorecard):
| Years After Graduation | Median Earnings |
|---|---|
| 1 year | $37,085 |
| 2 years | $36,437 |
| 3 years | $37,250 |
| 4 years | $41,198 |
| 5 years | $46,106 |
How do these earnings stack up against the rest of the school? At the four-year mark, Teacher Education Grade Specific graduates from Newman University earn a median of $41,198, compared with $67,327 for all Newman University graduates — about 39% lower than the school-wide median.

Median Debt at Graduation
The median debt for Teacher Education Grade Specific graduates from Newman University stands at $25,000.
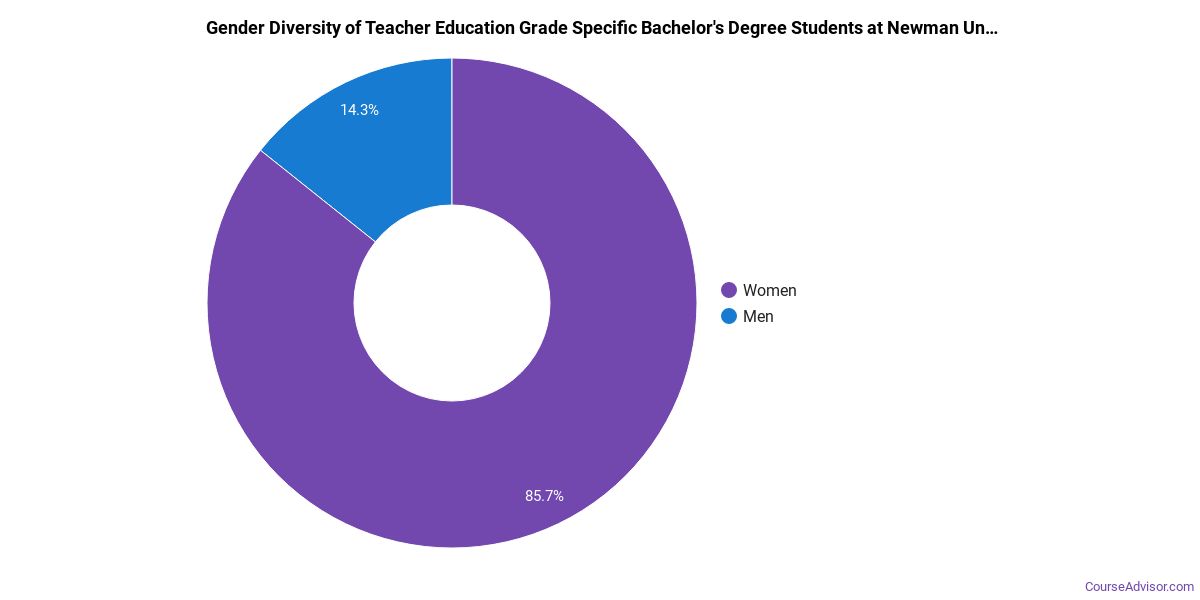
Student Demographics & Diversity
Take a look at the composition of Teacher Education Grade Specific graduates at Newman University, broken down by degree level.
Program-wide, Teacher Education Grade Specific graduates at Newman University are 83% women (43) and 17% men (9).
Teacher Education Grade Specific Bachelor’s Program at Newman University
Of the 52 bachelor’s teacher education grade specific degrees awarded at Newman University, 83% were women (43) and 17% were men (9).
The following table and chart show the race/ethnicity of Teacher Education Grade Specific bachelor’s degree recipients at Newman University.
| Race / Ethnicity | Number of Graduates |
|---|---|
| White | 29 |
| Hispanic / Latino | 21 |
| Two or More Races | 2 |
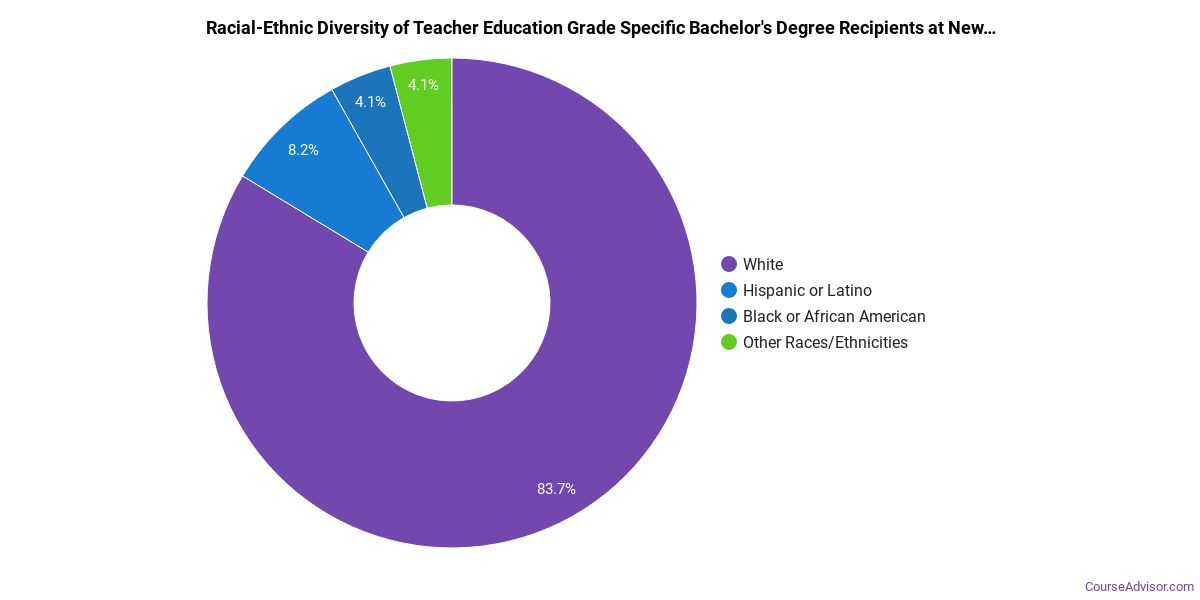
Minority students account for 44% of Teacher Education Grade Specific bachelor’s degree recipients at Newman University, higher than the national average of 29%.*
*The racial-ethnic minorities figure is the total number of graduates minus White, international (nonresident), and unknown-race graduates.
More Specific Teacher Education Grade Specific Concentrations at Newman University
The Teacher Education Grade Specific program at Newman University includes the following sub-specializations:
| Concentration | Graduates |
|---|---|
| Elementary Education | 44 |
| Secondary Education | 5 |
| Early Childhood Education | 3 |
Highest-Paying Careers for Teacher Education Grade Specific Graduates
Graduates of the Teacher Education Grade Specific program at Newman University pursue many career paths. Below are the best-paid careers for Teacher Education Grade Specific majors, ordered by median annual salary:
References
- IPEDS — Integrated Postsecondary Education Data System
- U.S. Department of Education — College Scorecard
- O*NET Online (Bureau of Labor Statistics)
- National Center for Education Statistics
More about our data sources and methodologies.
Course Advisor provides higher-education, college and university, degree, program, career, salary, and other helpful information to students, faculty, institutions, and other internet audiences. Presented information and data are subject to change. Inclusion on this website does not imply or represent a direct relationship with the company, school, or brand. Information, though believed correct at time of publication, may not be correct, and no warranty is provided. Contact the schools to verify any information before relying on it. Financial aid may be available for those who qualify. The displayed options may include sponsored or recommended results, not necessarily based on your preferences.
© Course Advisor – All Rights Reserved.