Liberal Arts at New York University
What traits are you looking for in a school for Liberal Arts, consider the program at New York University. We’ve gathered the following information to help you decide.
New York University is located in New York, NY.
In the most recent year for which we have data, 691 liberal arts graduations were recorded at New York University.
Featured schools near , edit
Online Class Availability at New York University
Online coursework is an option at New York University. Among 56,832 students, 3,493 (6%) were enrolled entirely in distance education and 10,998 (19%) took at least some classes online.
Student Demographics & Diversity
Take a look at the diversity of Liberal Arts graduates at New York University, broken down by degree level.
Looking at the program as a whole, Liberal Arts graduates at New York University are 70% women (482) and 30% men (209).
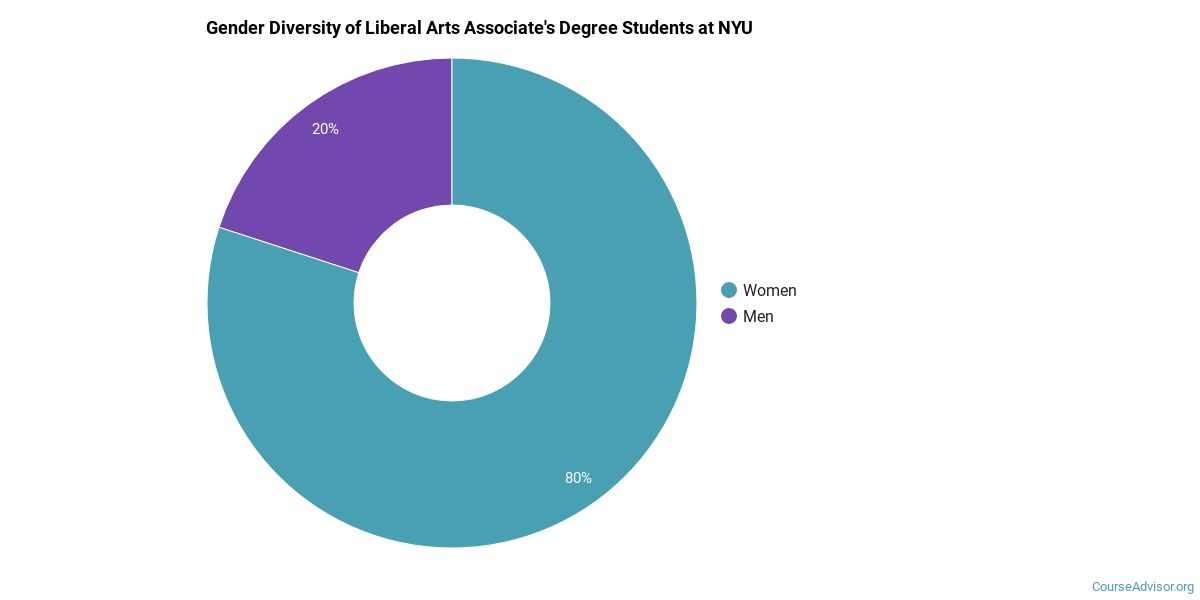
Liberal Arts Associate’s Program at New York University
Of the 16 associate’s liberal arts graduates at New York University, 50% were women (8) and 50% were men (8).
The following table and chart show the race/ethnicity of Liberal Arts associate’s degree recipients at New York University.
| Race / Ethnicity | Number of Graduates |
|---|---|
| White | 4 |
| Hispanic / Latino | 3 |
| Black / African American | 3 |
| Asian | 1 |
| International (Nonresident) | 3 |
| Unknown | 2 |

Minority students account for 44% of Liberal Arts associate’s degree recipients at New York University, below the national average of 48%.*
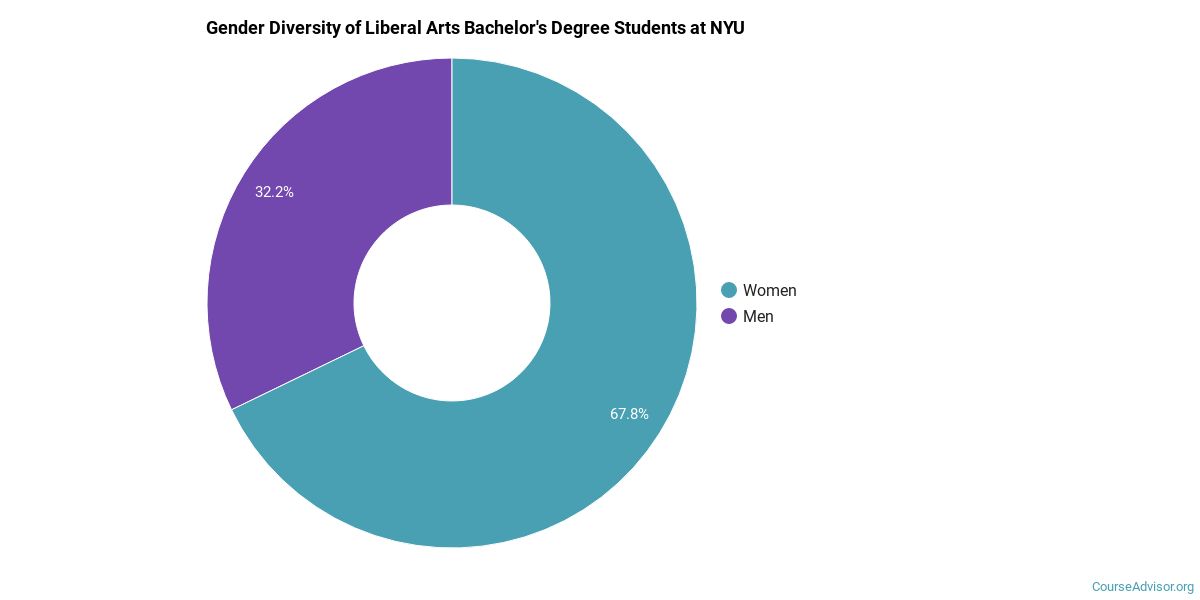
Liberal Arts Bachelor’s Program at New York University
Of the 634 bachelor’s liberal arts degrees awarded at New York University, 70% were women (443) and 30% were men (191).
The following table and chart show the race/ethnicity of Liberal Arts bachelor’s degree recipients at New York University.
| Race / Ethnicity | Number of Graduates |
|---|---|
| White | 249 |
| Hispanic / Latino | 134 |
| Black / African American | 53 |
| Asian | 74 |
| American Indian / Alaska Native | 3 |
| Native Hawaiian / Pacific Islander | 2 |
| Two or More Races | 32 |
| International (Nonresident) | 63 |
| Unknown | 24 |

Racial-ethnic minorities make up 47% of Liberal Arts bachelor’s degree recipients at New York University, higher than the national average of 46%.*
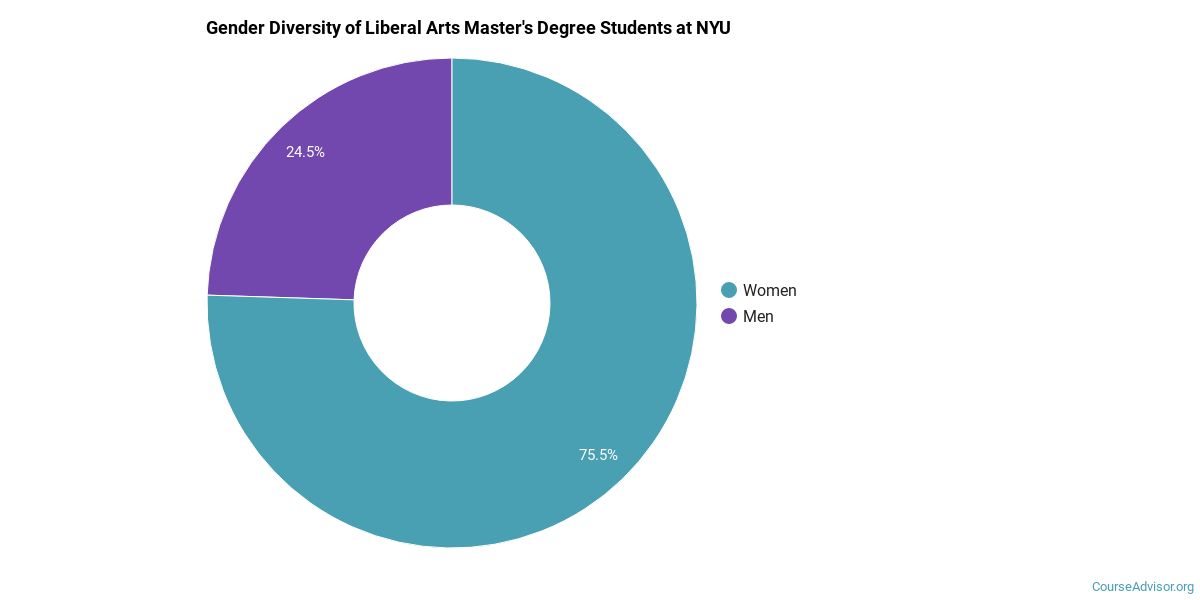
Liberal Arts Master’s Program at New York University
Of the 41 master’s liberal arts degrees awarded at New York University, 76% were women (31) and 24% were men (10).
The following table and chart show the race/ethnicity of Liberal Arts master’s degree recipients at New York University.
| Race / Ethnicity | Number of Graduates |
|---|---|
| White | 19 |
| Hispanic / Latino | 3 |
| Black / African American | 3 |
| Asian | 2 |
| Two or More Races | 2 |
| International (Nonresident) | 11 |
| Unknown | 1 |

Minority students account for 24% of Liberal Arts master’s degree recipients at New York University, lower than the national average of 29%.*
*The racial-ethnic minorities figure is the total number of graduates minus White, international (nonresident), and unknown-race graduates.
Top-Paying Careers for Liberal Arts Graduates
Those who complete Liberal Arts program at New York University work across a variety of fields. Here are the best-paid careers for Liberal Arts majors, ordered by median annual salary:
| Occupation | Nationwide Median Wage |
|---|---|
| Postsecondary Teachers, All Other | $68,967 |
References
- IPEDS — Integrated Postsecondary Education Data System
- U.S. Department of Education — College Scorecard
- O*NET Online (Bureau of Labor Statistics)
- National Center for Education Statistics
More about our data sources and methodologies.
Course Advisor provides higher-education, college and university, degree, program, career, salary, and other helpful information to students, faculty, institutions, and other internet audiences. Presented information and data are subject to change. Inclusion on this website does not imply or represent a direct relationship with the company, school, or brand. Information, though believed correct at time of publication, may not be correct, and no warranty is provided. Contact the schools to verify any information before relying on it. Financial aid may be available for those who qualify. The displayed options may include sponsored or recommended results, not necessarily based on your preferences.
© Course Advisor – All Rights Reserved.