Northeastern University Oakland Science & Tech Programs
Northeastern University Oakland is a private not-for-profit institution located in Oakland, CA. A Major City Center offers tranquility and safety close to urban amenities.
Featured schools near , edit
Northeastern University Oakland Rankings
Northeastern University Oakland is featured in these rankings for science & tech programs at the bachelors level:
| Ranking | Rank | Among |
|---|---|---|
| Overall Quality | #73 of 469 | State — California |
| Overall Quality | #101 of 667 | Region — Far Western |
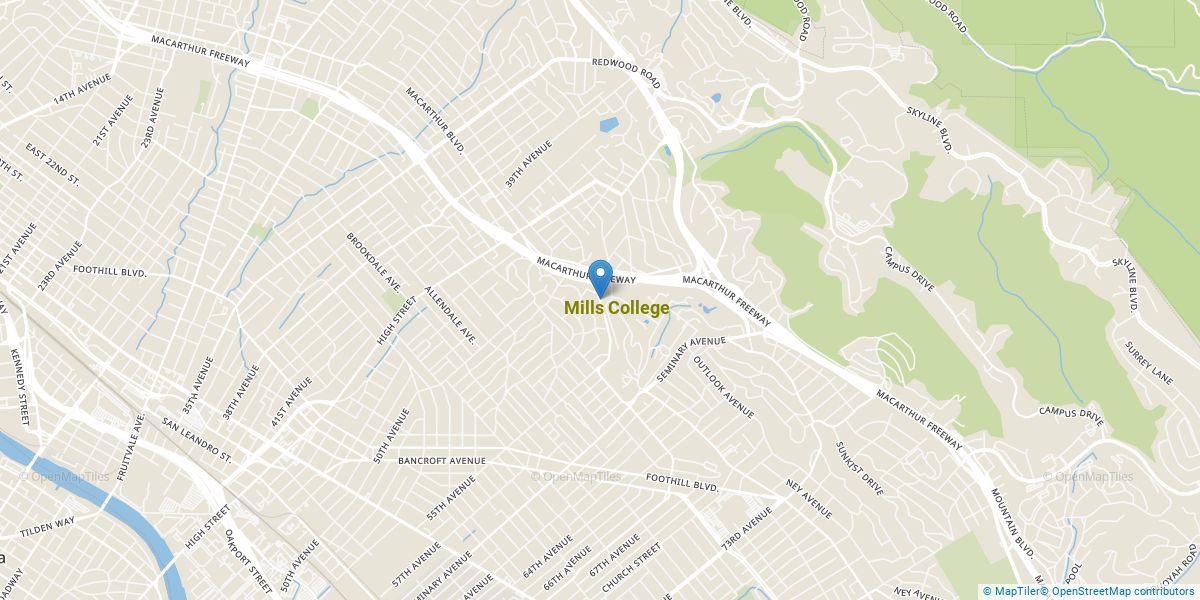
Where Is Northeastern University Oakland?
Get in touch with Northeastern University Oakland are listed below.
| Contact Details | |
|---|---|
| Address: | 5000 MacArthur Blvd, Oakland, CA 94613 |
| Phone: | 5104302255 |
| Website: | oakland.northeastern.edu/ |
| Admissions: | www.northeastern.edu/admissions/ |
| Financial Aid: | studentfinance.northeastern.edu/ |
How Do I Get Into Northeastern University Oakland?
You can apply to Northeastern University Oakland online at: https://www.commonapp.org/
Northeastern University Oakland is classified as Highly Selective (10-20%) for admissions.
Admission Requirements for Northeastern University Oakland
Here’s what Northeastern University Oakland requires for admission:
| Requirement | Status |
|---|---|
| Secondary School Record | Required |
| Secondary School GPA | Required |
| Recommendations | Required |
| Admission Test Scores (SAT/ACT) | Considered but not required |
How Hard Is It To Get Into Northeastern University Oakland?
Northeastern University Oakland admits 17%, which means it is very selective and competitive. Take time to make sure you submit all the requested materials and prepare the application in full.
Of those admitted, 15% choose to enroll — a modest enrollment yield, suggesting many admitted students choose other institutions.
Average Test Scores
20% of admitted students submitted SAT scores and 5% submitted ACT scores.
When looking at the 25th through the 75th percentile of admitted students at Northeastern University Oakland, SAT Evidence-Based Reading and Writing scores ranged between 690 and 740. Math scores were between 730 and 780.
Selectivity by Gender
Acceptance rates at Northeastern University Oakland can differ by gender.
| Gender | Applicants | Admitted | Acceptance Rate |
|---|---|---|---|
| Men | 8,170 | 1,374 | 17% |
| Women | 9,853 | 1,626 | 16% |
Can I Afford Northeastern University Oakland?
The average net price after aid at Northeastern University Oakland is $16,772. Cost varies significantly based on your financial situation since net price varies by income group.
Tuition & Fees
| Category | Cost |
|---|---|
| In-State Tuition | $64,990 |
| In-State Fees | $2,788 |
| Out-of-State Tuition | $64,990 |
| Out-of-State Fees | $2,788 |
| Total In-State Tuition & Fees | $67,778 |
| Total Out-of-State Tuition & Fees | $67,778 |
Financial Aid
Across all aid types, 89% of students at Northeastern University Oakland receive some form of financial aid (487 students).
Approximately 70% of students at Northeastern University Oakland receive grant or scholarship aid, averaging $59,676 per student.
27% of students receive federal Pell Grants, averaging $6,755.
Student Loan Debt
48% of Northeastern University Oakland undergraduates take out federal student loans, averaging $4,199 per year.
Northeastern University Oakland Undergraduate Student Diversity
Its Carnegie Classification is Master’s Colleges & Universities: Medium Programs.
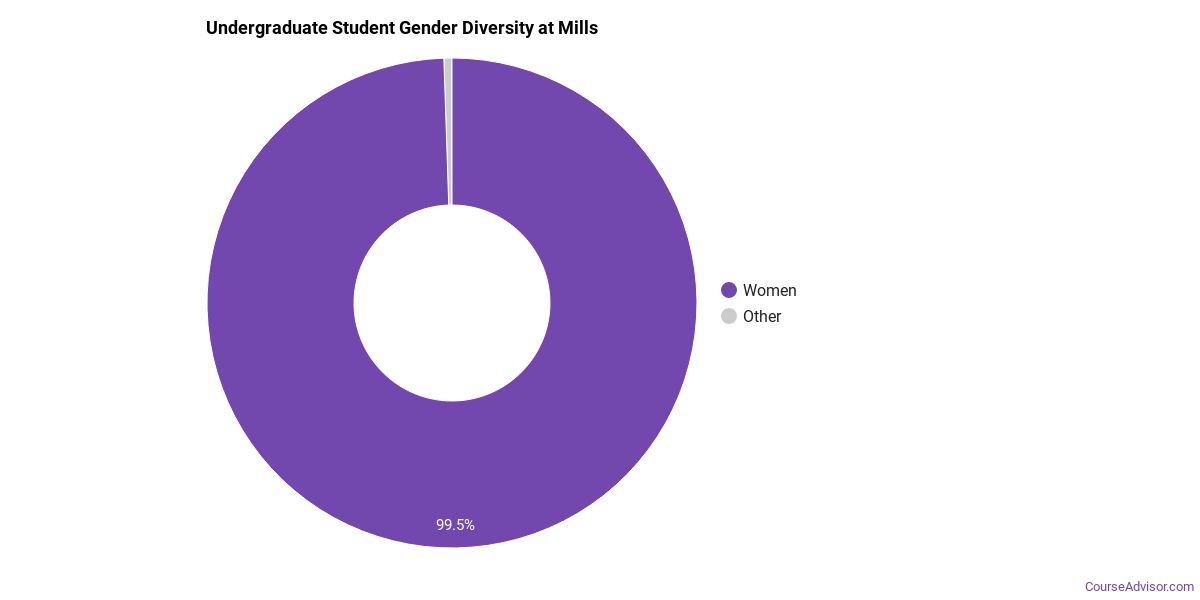
Gender Diversity
Of the 542 undergraduate students at Northeastern University Oakland, approximately 48% are male and 52% are female.
Racial-Ethnic Diversity
The racial-ethnic breakdown of Northeastern University Oakland undergraduate students is as follows.
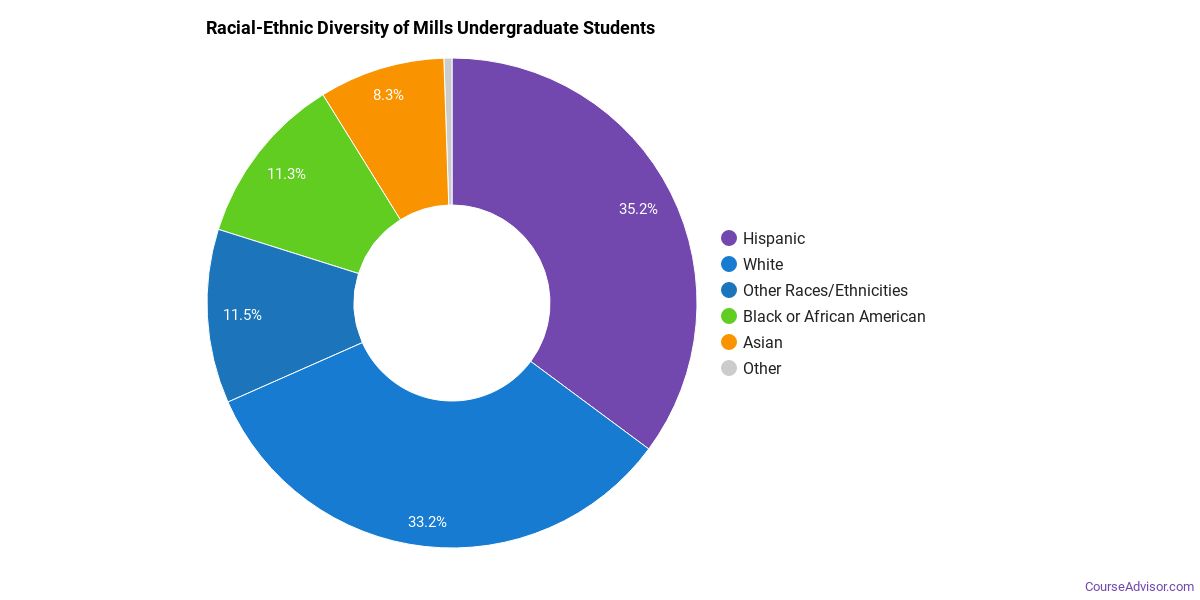
| Race/Ethnicity | Number of Students |
|---|---|
| Asian | 215 |
| Black or African American | 37 |
| Hispanic | 35 |
| White | 121 |
| Two or More Races | 29 |
| Non-Resident | 81 |
Geographic Diversity
The top 5 home states of first-time undergraduate students at Northeastern University Oakland break down as follows.

| State | First-Time UG Students |
|---|---|
| New York | 74 |
| California | 73 |
| Massachusetts | 59 |
| New Jersey | 41 |
| Connecticut | 19 |
Additionally, approximately 15.1% of undergraduate students are non-resident from outside the United States.
Northeastern University Oakland Graduate Student Diversity
116 of Northeastern University Oakland’s students are in graduate programs. The highest graduate-level award offered is Post-master’s certificate.
Gender Diversity (Graduate)
Among graduate students at Northeastern University Oakland, approximately 55% are male and 45% are female.

Racial-Ethnic Diversity (Graduate)
The racial-ethnic breakdown of Northeastern University Oakland graduate students is as follows.

| Race/Ethnicity | Number of Students |
|---|---|
| Asian | 5 |
| Black or African American | 1 |
| Hispanic | 2 |
| White | 3 |
| Non-Resident | 98 |
Online Learning at Northeastern University Oakland
Northeastern University Oakland offers distance learning options for students who need flexibility.
446 undergraduate students at Northeastern University Oakland took at least one online class — of those, 1 took all of their classes online.
At the graduate level, 84 students took at least one online class and 2 took all classes online. Distance education is available at the undergraduate and graduate levels.
Academic Programs at Northeastern University Oakland
Northeastern University Oakland offers 13 distinct academic programs.
The highest level of award offered is Post-master’s certificate.
Institutional Profile
Northeastern University Oakland maintains an open admission policy: No. Credit transfer:
- AP credits: Yes
- Dual enrollment credits: Yes
- Life experience credits: Implied no
References
More about our data sources and methodologies.
Course Advisor provides higher-education, college and university, degree, program, career, salary, and other helpful information to students, faculty, institutions, and other internet audiences. Presented information and data are subject to change. Inclusion on this website does not imply or represent a direct relationship with the company, school, or brand. Information, though believed correct at time of publication, may not be correct, and no warranty is provided. Contact the schools to verify any information before relying on it. Financial aid may be available for those who qualify. The displayed options may include sponsored or recommended results, not necessarily based on your preferences.
© Course Advisor – All Rights Reserved.