Mid-EastCTC-Adult Education Overview
Located in Zanesville, Ohio, Mid-EastCTC-Adult Education is a public institution. Mid-EastCTC-Adult Education is located in the countryside, which is perfect for students who enjoy a rural lifestyle.
What Is Mid-EastCTC-Adult Education Known For?
- Students who want to work more closely with their professors have an easier time at Mid-EastCTC-Adult Education since the student to facuty ratio is 4 to 1.
- The highest award offered at Mid-EastCTC-Adult Education is the undergraduate certificate.
Where Is Mid-EastCTC-Adult Education?
Contact details for Mid-EastCTC-Adult Education are given below.
| Contact Details | |
|---|---|
| Address: | 400 Richards Rd, Zanesville, OH 43701 |
| Phone: | 740-455-3111 |
| Website: | adulted.mideastctc.org |
How Do I Get Into Mid-EastCTC-Adult Education?
You can apply to Mid-EastCTC-Adult Education online at: https://mec.axstudent.com/#/categories
Can I Afford Mid-EastCTC-Adult Education?
Student Loan Debt
Almost 66% of college students who graduated with the class of 2018 took out student loans, but that percentage varies from school to school. At Mid-EastCTC-Adult Education, approximately 23% of students took out student loans averaging $5,693 a year. That adds up to $22,772 over four years for those students.
Explore Best Ranked Schools for You
Mid-EastCTC-Adult Education Undergraduate Student Diversity
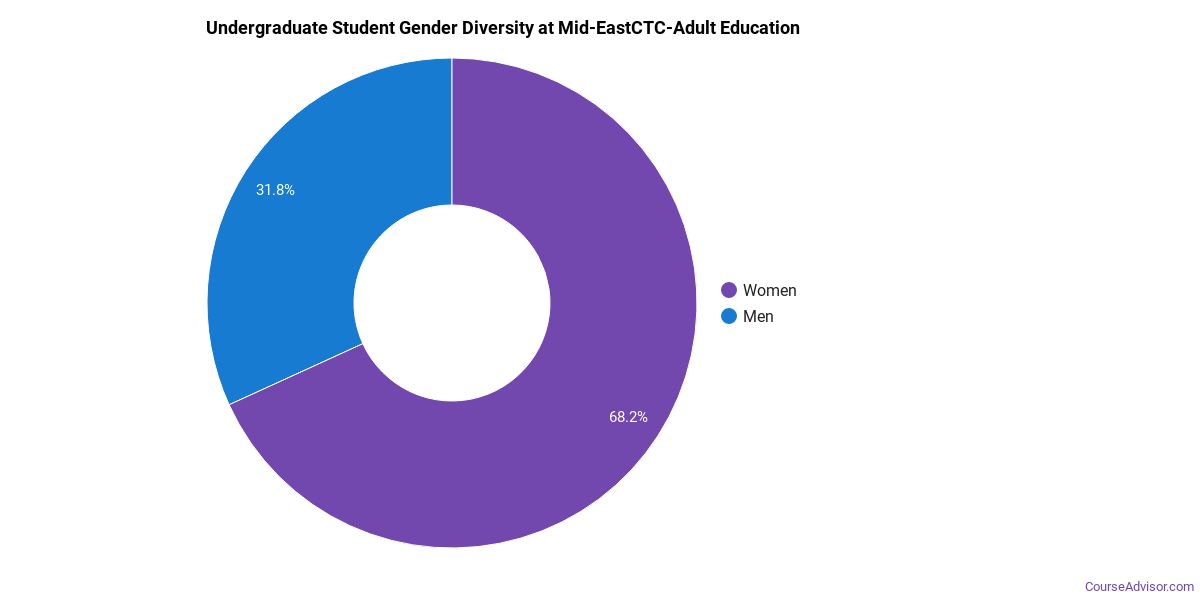
Gender Diversity
Of the 165 full-time undergraduates at Mid-EastCTC-Adult Education, 56% are male and 44% are female.
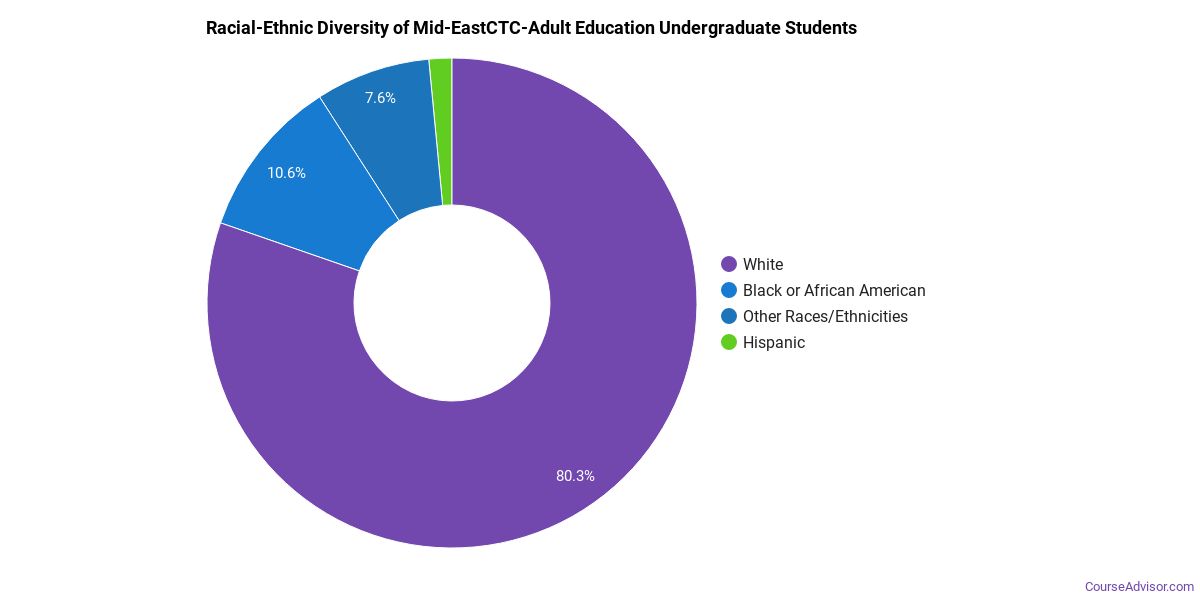
Racial-Ethnic Diversity
The racial-ethnic breakdown of Mid-EastCTC-Adult Education students is as follows.
| Race/Ethnicity | Number of Grads |
|---|---|
| Asian | 1 |
| Black or African American | 13 |
| Hispanic or Latino | 1 |
| White | 143 |
| International Students | 0 |
| Other Races/Ethnicities | 7 |
Mid-EastCTC-Adult Education Undergraduate Concentrations
The table below shows the number of awards for each concentration.
| Major | Basic Certificate | Undergraduate Certificate | TOTAL |
|---|---|---|---|
| Ground Transportation | 145 | 0 | 145 |
| Practical Nursing & Nursing Assistants | 69 | 36 | 105 |
| Allied Health Professions | 62 | 20 | 82 |
| Fire Protection | 32 | 0 | 32 |
| Clinical/Medical Laboratory Science | 25 | 0 | 25 |
| Electrical & Power Transmission Installers | 8 | 15 | 23 |
| Nursing | 0 | 22 | 22 |
| Precision Metal Working | 10 | 0 | 10 |
| Information Technology | 5 | 0 | 5 |
| TOTAL | 356 | 93 | 449 |
References
*The racial-ethnic minorities count is calculated by taking the total number of students and subtracting white students, international students, and students whose race/ethnicity was unknown. This number is then divided by the total number of students at the school to obtain the racial-ethnic minorities percentage.
More about our data sources and methodologies.
Course Advisor provides higher-education, college and university, degree, program, career, salary, and other helpful information to students, faculty, institutions, and other internet audiences. Presented information and data are subject to change. Inclusion on this website does not imply or represent a direct relationship with the company, school, or brand. Information, though believed correct at time of publication, may not be correct, and no warranty is provided. Contact the schools to verify any information before relying on it. Financial aid may be available for those who qualify. The displayed options may include sponsored or recommended results, not necessarily based on your preferences.
© Course Advisor – All Rights Reserved.