Physics at Michigan Technological University
What traits are you looking for in a school for Physics, consider the program at Michigan Technological University. Get started with the following essential facts.
Michigan Technological University is located in Houghton, MI.
During the most recent reporting year, 26 physics degrees were awarded at Michigan Technological University.
Featured schools near , edit
Studying Online at Michigan Technological University
Many students take online classes at Michigan Technological University. Among 7,403 students, 352 (5%) studied exclusively online and 490 (7%) took at least some classes online.
Student Demographics & Diversity
Below you’ll find the composition of Physics graduates at Michigan Technological University, by degree type.
Looking at the program as a whole, Physics graduates at Michigan Technological University are 38% women (10) and 62% men (16).
Physics Bachelor’s Program at Michigan Technological University
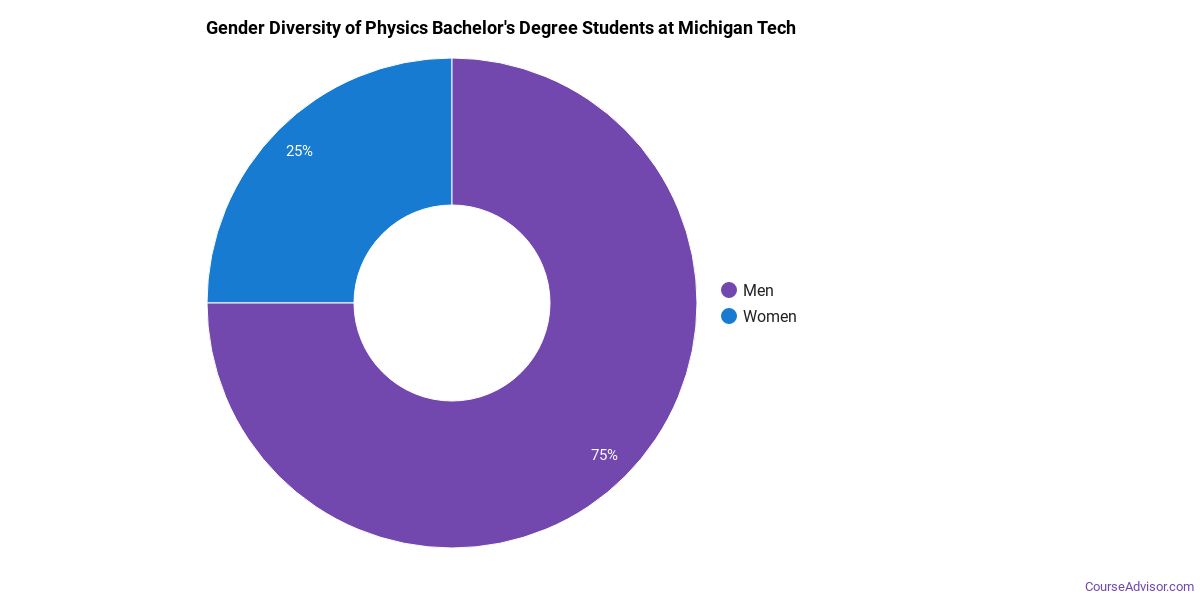
Of the 8 bachelor’s physics graduates at Michigan Technological University, 38% were women (3) and 62% were men (5).
The following table and chart show the race/ethnicity of Physics bachelor’s degree recipients at Michigan Technological University.
| Race / Ethnicity | Number of Graduates |
|---|---|
| White | 6 |
| Two or More Races | 1 |
| International (Nonresident) | 1 |
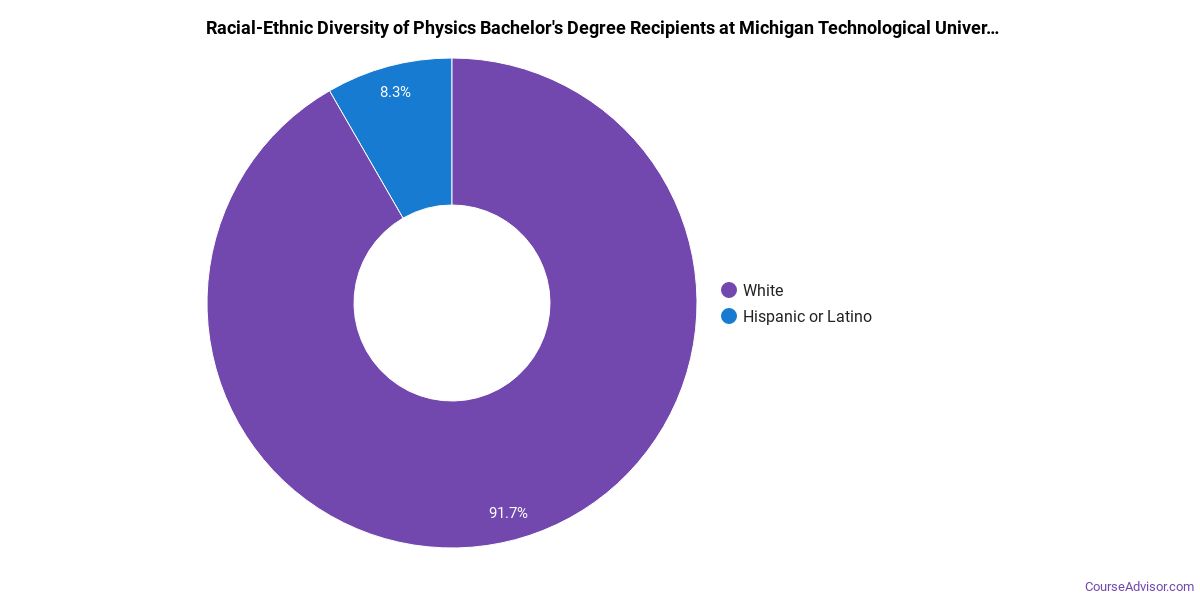
Racial-ethnic minorities make up 12% of Physics bachelor’s degree recipients at Michigan Technological University, lower than the national average of 30%.*
Physics Master’s Program at Michigan Technological University
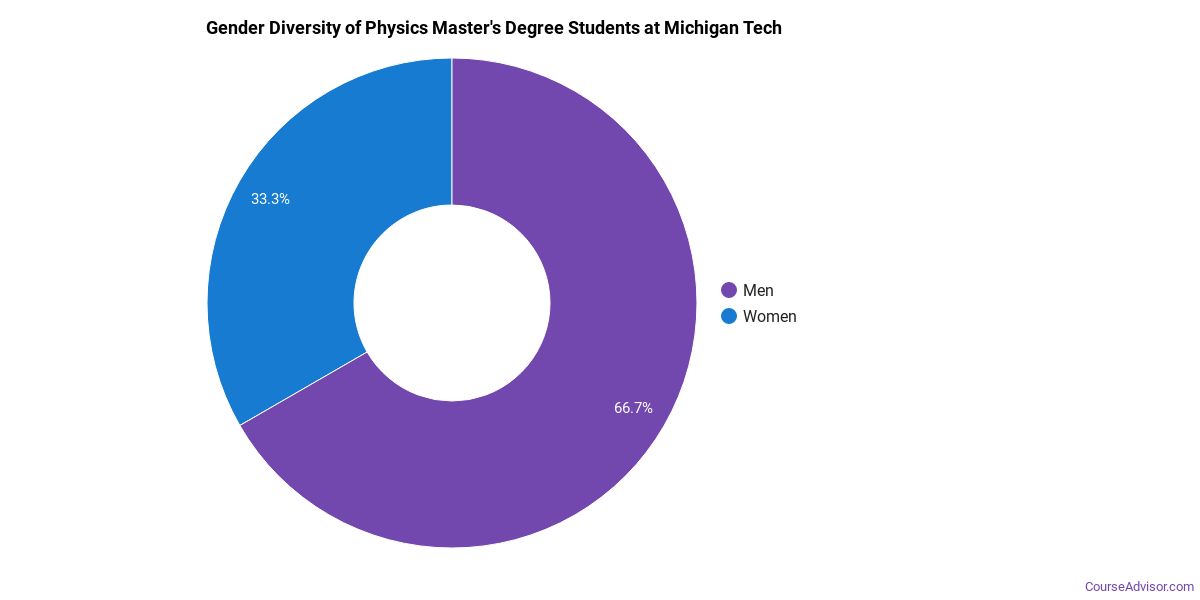
Of the 5 master’s physics degrees awarded at Michigan Technological University, 20% were women (1) and 80% were men (4).
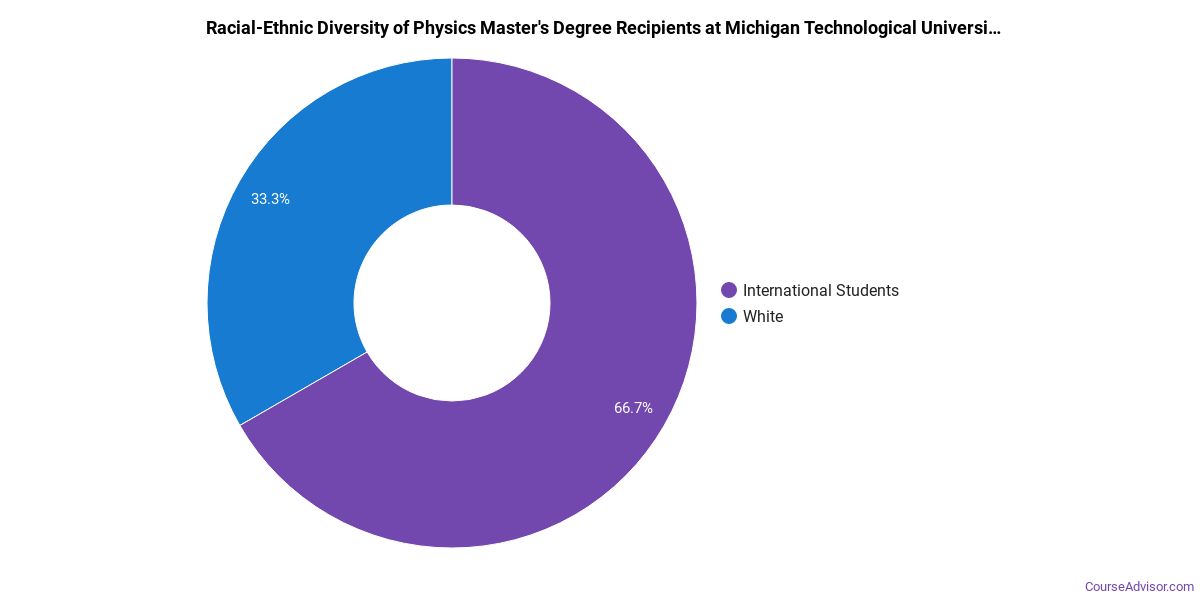
The following table and chart show the race/ethnicity of Physics master’s degree recipients at Michigan Technological University.
| Race / Ethnicity | Number of Graduates |
|---|---|
| White | 3 |
| International (Nonresident) | 2 |
Physics Doctoral Program at Michigan Technological University
Among the 6 doctoral physics graduates at Michigan Technological University, 33% were women (2) and 67% were men (4).

The following table and chart show the race/ethnicity of Physics doctoral degree recipients at Michigan Technological University.
| Race / Ethnicity | Number of Graduates |
|---|---|
| White | 2 |
| International (Nonresident) | 3 |
| Unknown | 1 |

*The racial-ethnic minorities figure is the total number of graduates minus White, international (nonresident), and unknown-race graduates.
More Specific Physics Concentrations at Michigan Technological University
The Physics program at Michigan Technological University offers more specialized concentrations:
| Concentration | Graduates |
|---|---|
| General Physics | 19 |
| Optics/Optical Sciences | 1 |
| Condensed Matter & Materials Physics | 3 |
| Theoretical & Mathematical Physics | 3 |
Highest-Paying Careers for Physics Graduates
Graduates of the Physics program at Michigan Technological University go on to a range of careers. The table below ranks the top-paying careers for Physics graduates, ordered by median annual salary:
| Occupation | Nationwide Median Wage |
|---|---|
| Water Resource Specialists | $179,716 |
| Natural Sciences Managers | $132,227 |
| Physicists | $111,776 |
| Clinical Research Coordinators | $110,931 |
| Physics Teachers, Postsecondary | $80,685 |
| Secondary School Teachers, Except Special and Career/Technical Education | $77,927 |
References
- IPEDS — Integrated Postsecondary Education Data System
- U.S. Department of Education — College Scorecard
- O*NET Online (Bureau of Labor Statistics)
- National Center for Education Statistics
More about our data sources and methodologies.
Course Advisor provides higher-education, college and university, degree, program, career, salary, and other helpful information to students, faculty, institutions, and other internet audiences. Presented information and data are subject to change. Inclusion on this website does not imply or represent a direct relationship with the company, school, or brand. Information, though believed correct at time of publication, may not be correct, and no warranty is provided. Contact the schools to verify any information before relying on it. Financial aid may be available for those who qualify. The displayed options may include sponsored or recommended results, not necessarily based on your preferences.
© Course Advisor – All Rights Reserved.