Social Work at Michigan State University
If you plan to study Social Work, consider the program at Michigan State University. Get started with the following essential facts.
Michigan State University is in East Lansing, MI.
For the most recent IPEDS reporting year, 77 social work graduations were recorded at Michigan State University.
Featured schools near , edit
Studying Online at Michigan State University
Online coursework is an option at Michigan State University. Among 52,089 students, 2,681 (5%) were enrolled entirely in distance education and 24,643 (47%) took at least some classes online.
Social Work Rankings at Michigan State University
Rankings can help you compare Michigan State University’s Social Work program to other colleges that offer this major.
Bachelor’s-Level Rankings
| Ranking | Scope | Rank |
|---|---|---|
| Best Schools (Quality) | Michigan | #2 of 22 |
| Best Schools (Quality) | Great Lakes (Region) | #15 of 109 |
| Best Value | Michigan | #17 of 22 |
| Best Value | Great Lakes (Region) | #84 of 110 |
| Best Schools (Quality) | Nationwide | #117 of 570 |
| Best Value | Nationwide | #399 of 567 |
Master’s-Level Rankings
| Ranking | Scope | Rank |
|---|---|---|
| Best Schools (Quality) | Michigan | #2 of 22 |
| Best Schools (Quality) | Great Lakes (Region) | #15 of 109 |
| Best Value | Michigan | #17 of 22 |
| Best Value | Great Lakes (Region) | #84 of 110 |
| Best Schools (Quality) | Nationwide | #117 of 570 |
| Best Value | Nationwide | #399 of 567 |
Doctoral-Level Rankings
| Ranking | Scope | Rank |
|---|---|---|
| Best Schools (Quality) | Michigan | #2 of 22 |
| Best Schools (Quality) | Great Lakes (Region) | #15 of 109 |
| Best Value | Michigan | #17 of 22 |
| Best Value | Great Lakes (Region) | #84 of 110 |
| Best Schools (Quality) | Nationwide | #117 of 570 |
| Best Value | Nationwide | #399 of 567 |
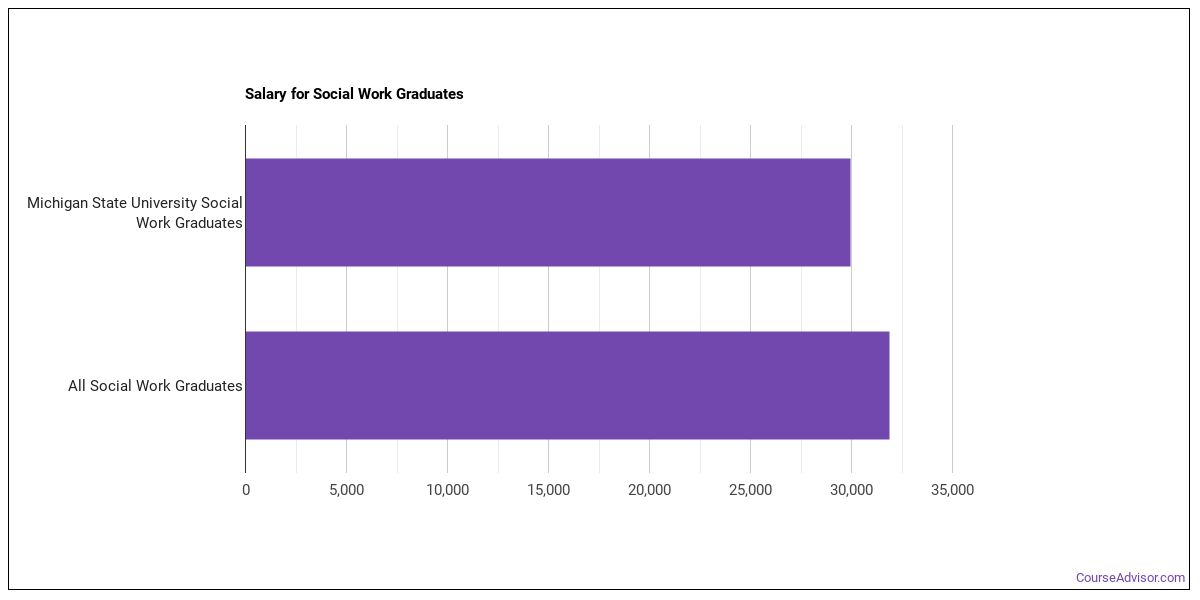
Earnings for Social Work Graduates from Michigan State University
Students who complete Michigan State University’s Social Work program earn the following amounts (per the U.S. Department of Education’s College Scorecard):
| Years After Graduation | Median Earnings |
|---|---|
| 1 year | $33,058 |
| 2 years | $36,778 |
| 3 years | $45,212 |
| 4 years | $50,319 |
| 5 years | $57,417 |
How does this compare to the school overall? Four years after graduating, Social Work graduates from Michigan State University report median earnings of $50,319, compared with $69,754 for all Michigan State University graduates — about 28% lower than the school-wide median.

Median Debt at Graduation
Median student loan debt for Social Work graduates from Michigan State University comes in at $26,169.
Student Demographics & Diversity
The following sections describe the student demographics for Social Work graduates at Michigan State University, by degree type.
Program-wide, Social Work graduates at Michigan State University are 84% women (65) and 16% men (12).
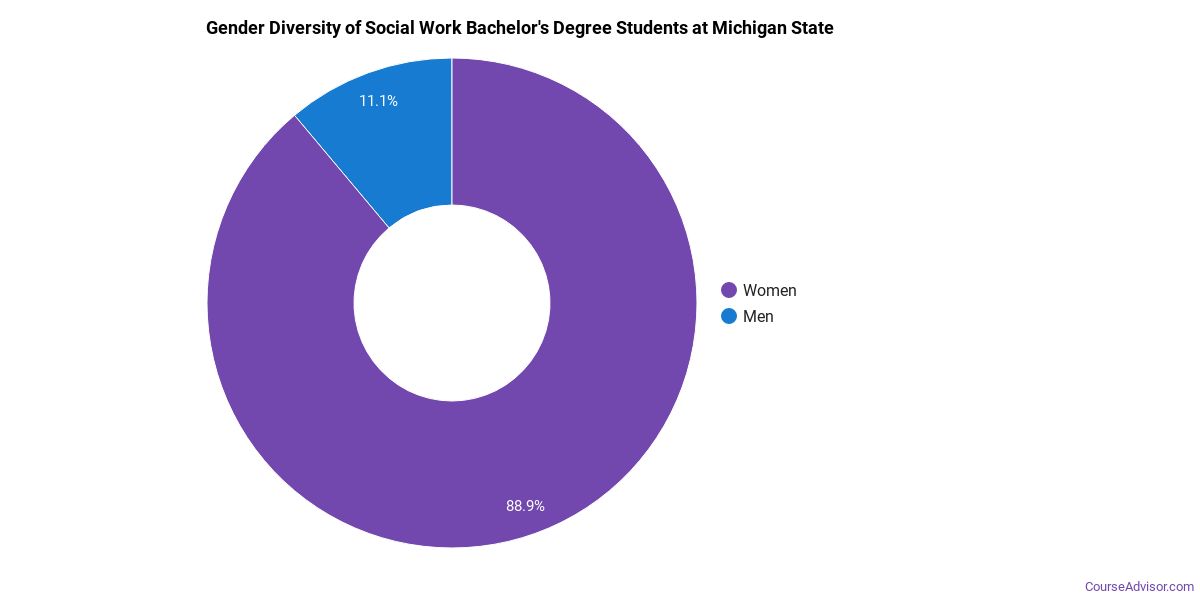
Social Work Bachelor’s Program at Michigan State University
Among the 51 bachelor’s social work degrees awarded at Michigan State University, 90% were women (46) and 10% were men (5).
The following table and chart show the race/ethnicity of Social Work bachelor’s degree recipients at Michigan State University.
| Race / Ethnicity | Number of Graduates |
|---|---|
| White | 41 |
| Hispanic / Latino | 6 |
| Black / African American | 1 |
| American Indian / Alaska Native | 1 |
| Two or More Races | 1 |
| Unknown | 1 |
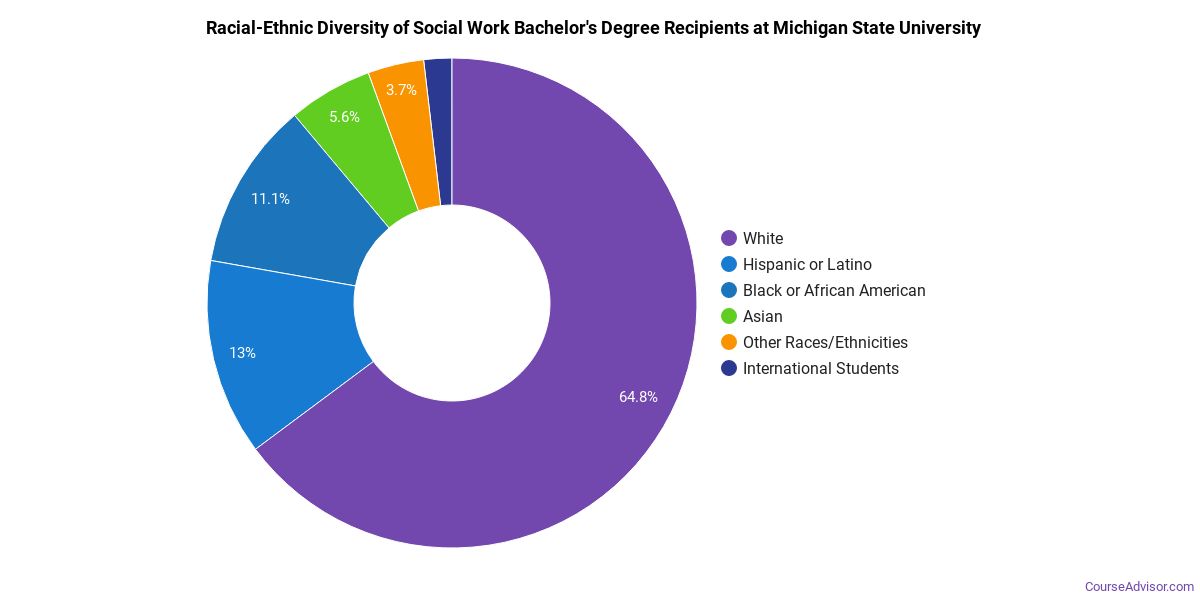
Racial-ethnic minorities make up 18% of Social Work bachelor’s degree recipients at Michigan State University, below the national average of 48%.*
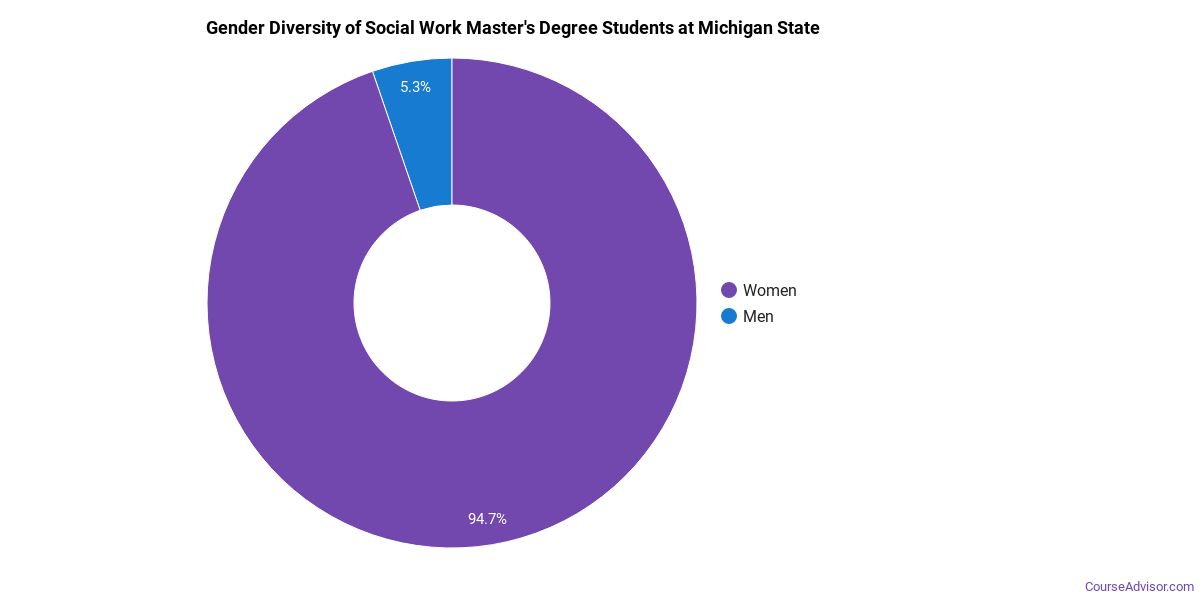
Social Work Master’s Program at Michigan State University
Among the 24 master’s social work degrees awarded at Michigan State University, 75% were women (18) and 25% were men (6).
The following table and chart show the race/ethnicity of Social Work master’s degree recipients at Michigan State University.
| Race / Ethnicity | Number of Graduates |
|---|---|
| White | 18 |
| Hispanic / Latino | 2 |
| Black / African American | 2 |
| Asian | 1 |
| Two or More Races | 1 |
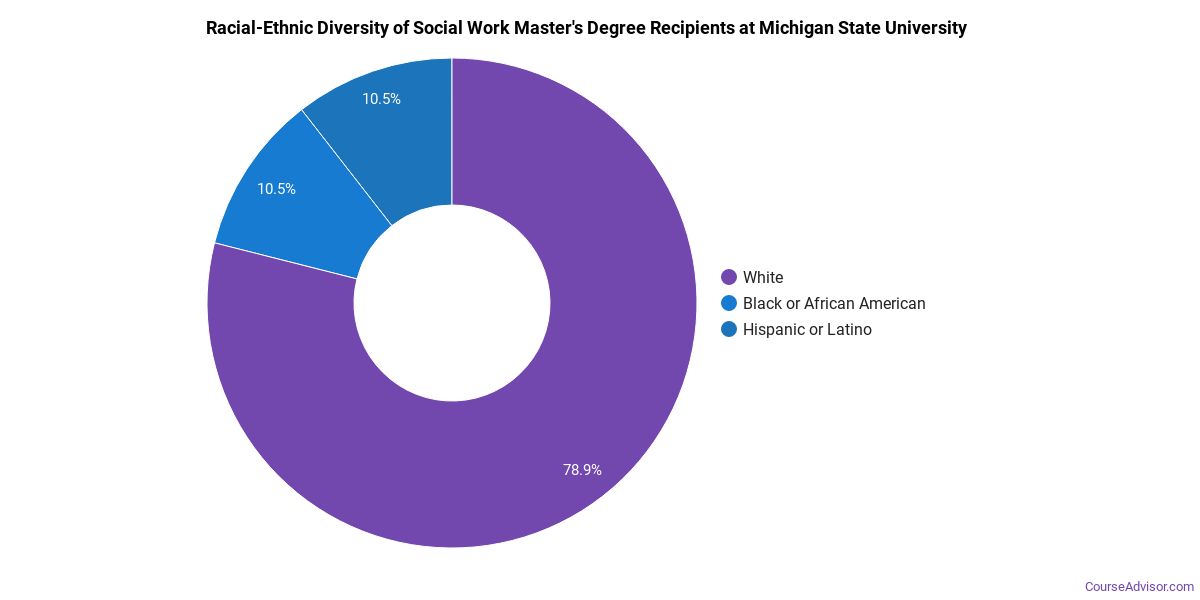
Minority students account for 25% of Social Work master’s degree recipients at Michigan State University, lower than the national average of 42%.*
Social Work Doctoral Program at Michigan State University
Of the 2 doctoral social work graduates at Michigan State University, 50% were women (1) and 50% were men (1).

The following table and chart show the race/ethnicity of Social Work doctoral degree recipients at Michigan State University.
| Race / Ethnicity | Number of Graduates |
|---|---|
| White | 2 |

*The racial-ethnic minorities figure is the total number of graduates minus White, international (nonresident), and unknown-race graduates.
More Specific Social Work Concentrations at Michigan State University
This Social Work program at Michigan State University breaks down into more specific concentrations:
| Concentration | Graduates |
|---|---|
| Social Work | 77 |
Highest-Paying Careers for Social Work Graduates
Graduates of the Social Work program at Michigan State University pursue many career paths. The table below ranks the best-paid careers for Social Work graduates, ordered by median annual salary:
| Occupation | Nationwide Median Wage |
|---|---|
| Social and Community Service Managers | $156,089 |
| Counselors, All Other | $81,766 |
| Healthcare Social Workers | $78,044 |
| Marriage and Family Therapists | $74,325 |
| Social Work Teachers, Postsecondary | $65,510 |
| Social Workers, All Other | $62,827 |
| Mental Health and Substance Abuse Social Workers | $58,560 |
| Child, Family, and School Social Workers | $41,658 |
| Probation Officers and Correctional Treatment Specialists | $40,804 |
References
- IPEDS — Integrated Postsecondary Education Data System
- U.S. Department of Education — College Scorecard
- O*NET Online (Bureau of Labor Statistics)
- National Center for Education Statistics
More about our data sources and methodologies.
Course Advisor provides higher-education, college and university, degree, program, career, salary, and other helpful information to students, faculty, institutions, and other internet audiences. Presented information and data are subject to change. Inclusion on this website does not imply or represent a direct relationship with the company, school, or brand. Information, though believed correct at time of publication, may not be correct, and no warranty is provided. Contact the schools to verify any information before relying on it. Financial aid may be available for those who qualify. The displayed options may include sponsored or recommended results, not necessarily based on your preferences.
© Course Advisor – All Rights Reserved.