Louisiana State University Health Sciences Center - New Orleans Overview
Located in New Orleans, Louisiana, Louisiana State University Health Sciences Center - New Orleans is a public institution. The location of the school is great for students who enjoy the amenities of city life.
What Is Louisiana State University Health Sciences Center - New Orleans Known For?
- LSU Health - New Orleans has an impressive student to faculty ratio of 3 to 1.
- The highest award offered at LSU Health - New Orleans is the doctor's degree.
- During a recent academic cycle, 69% of the faculty were full-time.
- A student who earns a bachelor's degree from LSU Health - New Orleans makes roughly $78,495 a year. This is 92% more than their peers from other colleges and universities.
Where Is Louisiana State University Health Sciences Center - New Orleans?
Contact details for LSU Health - New Orleans are given below.
| Contact Details | |
|---|---|
| Address: | 433 Bolivar St, New Orleans, LA 70112-2223 |
| Phone: | 504-568-4808 |
| Website: | www.lsuhsc.edu |
Can I Afford Louisiana State University Health Sciences Center - New Orleans?
Explore Best Ranked Schools for You
Louisiana State University Health Sciences Center - New Orleans Undergraduate Student Diversity
There are also 1,923 graduate students at the school.
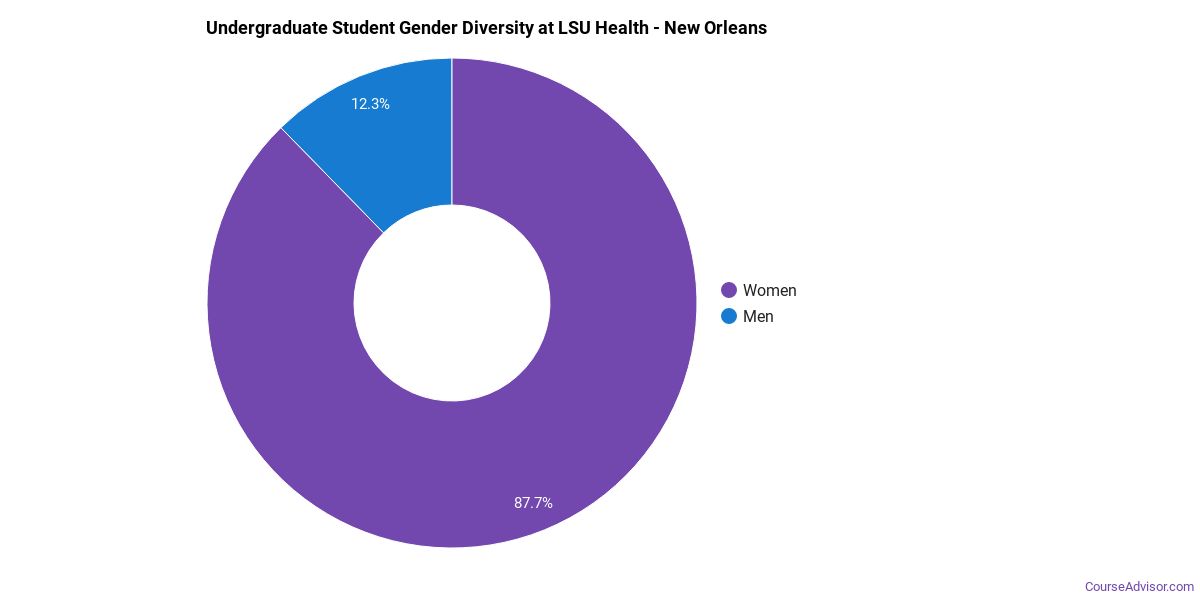
Gender Diversity
Of the 783 full-time undergraduates at LSU Health - New Orleans, 15% are male and 85% are female.
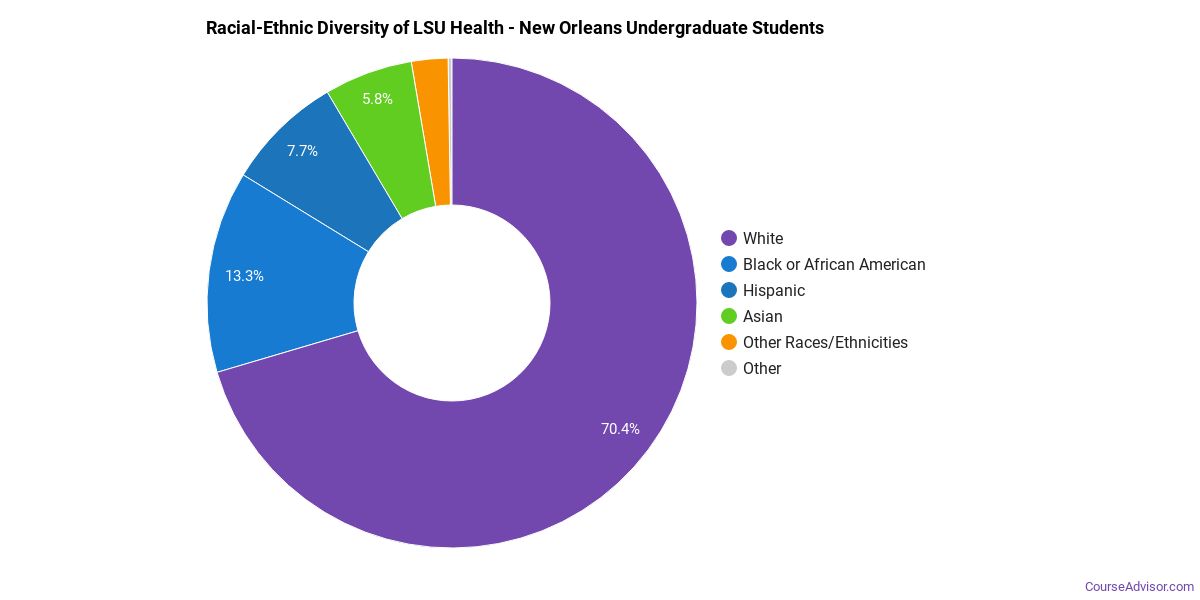
Racial-Ethnic Diversity
The racial-ethnic breakdown of Louisiana State University Health Sciences Center - New Orleans students is as follows.
| Race/Ethnicity | Number of Grads |
|---|---|
| Asian | 43 |
| Black or African American | 93 |
| Hispanic or Latino | 54 |
| White | 573 |
| International Students | 0 |
| Other Races/Ethnicities | 20 |
Over 30 countries are represented at LSU Health - New Orleans. The most popular countries sending students to the school are India, China, and Nepal.
Louisiana State University Health Sciences Center - New Orleans Undergraduate Concentrations
The table below shows the number of awards for each concentration.
| Major | Associate’s | Bachelor’s | Master’s | Doctor’s | TOTAL |
|---|---|---|---|---|---|
| Nursing | 0 | 236 | 0 | 70 | 306 |
| Medicine | 0 | 0 | 0 | 196 | 196 |
| Dentistry | 0 | 0 | 0 | 77 | 77 |
| Rehabilitation & Therapeutic Professions | 0 | 0 | 39 | 30 | 69 |
| Allied Health Professions | 0 | 15 | 35 | 0 | 50 |
| Public Health | 0 | 4 | 42 | 2 | 48 |
| Dental Support Services | 2 | 37 | 0 | 0 | 39 |
| Communication Sciences | 0 | 0 | 19 | 9 | 28 |
| Clinical/Medical Laboratory Science | 0 | 22 | 0 | 0 | 22 |
| Advanced Dentistry & Oral Sciences | 0 | 0 | 17 | 0 | 17 |
| Biomathematics & Bioinformatics | 0 | 0 | 4 | 1 | 5 |
| Cell Biology & Anatomical Sciences | 0 | 0 | 0 | 4 | 4 |
| Pharmacology & Toxicology | 0 | 0 | 0 | 4 | 4 |
| Physiology & Pathology Sciences | 0 | 0 | 0 | 4 | 4 |
| Biochemistry, Biophysics & Molecular Biology | 0 | 0 | 0 | 2 | 2 |
| Ecology, Evolution & Systematics Biology | 0 | 0 | 0 | 1 | 1 |
| General Biology | 0 | 0 | 1 | 0 | 1 |
| Genetics | 0 | 0 | 0 | 1 | 1 |
| Microbiological Sciences & Immunology | 0 | 0 | 0 | 0 | 0 |
| Neurobiology & Neurosciences | 0 | 0 | 0 | 0 | 0 |
| TOTAL | 2 | 314 | 157 | 401 | 874 |
References
*The racial-ethnic minorities count is calculated by taking the total number of students and subtracting white students, international students, and students whose race/ethnicity was unknown. This number is then divided by the total number of students at the school to obtain the racial-ethnic minorities percentage.
- College Factual
- National Center for Education Statistics
- Image Credit: By Infrogmation of New Orleans under License
More about our data sources and methodologies.
Course Advisor provides higher-education, college and university, degree, program, career, salary, and other helpful information to students, faculty, institutions, and other internet audiences. Presented information and data are subject to change. Inclusion on this website does not imply or represent a direct relationship with the company, school, or brand. Information, though believed correct at time of publication, may not be correct, and no warranty is provided. Contact the schools to verify any information before relying on it. Financial aid may be available for those who qualify. The displayed options may include sponsored or recommended results, not necessarily based on your preferences.
© Course Advisor – All Rights Reserved.