Los Angeles Valley College Science & Tech Programs
Los Angeles Valley College is a public institution located in Valley Glen, CA. A Major City Center offers an ideal setting near the excitement of urban amenities.
Featured schools near , edit
Where Is Los Angeles Valley College?
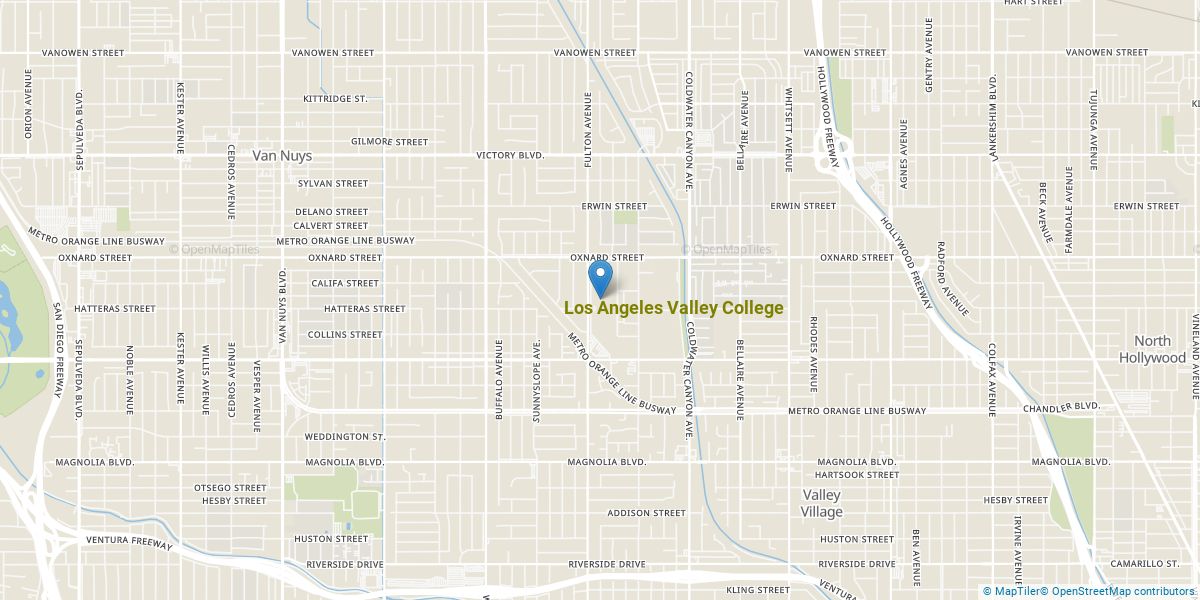
Contact details for LA Valley College are given below.
| Contact Details | |
|---|---|
| Address: | 5800 Fulton Avenue, Valley Glen, CA 91401-4096 |
| Phone: | 8189472600 |
| Website: | www.lavc.edu/ |
| Admissions: | www.lavc.edu/admissions |
| Financial Aid: | www.lavc.edu/financial-aid |
How Do I Get Into LA Valley College?
You can apply to LA Valley College online at: www.laccd.edu/Students/opencccapply/applylavc/Pages/default.aspx
How Hard Is It To Get Into LA Valley College?
Average Test Scores
Can I Afford Los Angeles Valley College?
The average net price after aid at LA Valley College is $10,200. Your actual cost will depend on your family’s circumstances since net price varies by income group.
Tuition & Fees
| Category | Cost |
|---|---|
| In-State Tuition | $1,196 |
| In-State Fees | $42 |
| Out-of-State Tuition | $10,530 |
| Out-of-State Fees | $42 |
| Total In-State Tuition & Fees | $1,238 |
| Total Out-of-State Tuition & Fees | $10,572 |
Financial Aid
Counting all forms of financial assistance, 6% of students at LA Valley College receive some form of financial aid (960 students).
About 58% of students at LA Valley College receive grant or scholarship aid, averaging $3,841 per student.
26% of students receive federal Pell Grants, averaging $4,861.
Student Loan Debt
2% of LA Valley College undergraduates take out federal student loans, averaging $7,307 per year.
Los Angeles Valley College Undergraduate Student Diversity
Its Carnegie Classification is Associate’s Colleges: High Transfer-Mixed Traditional/Nontraditional.
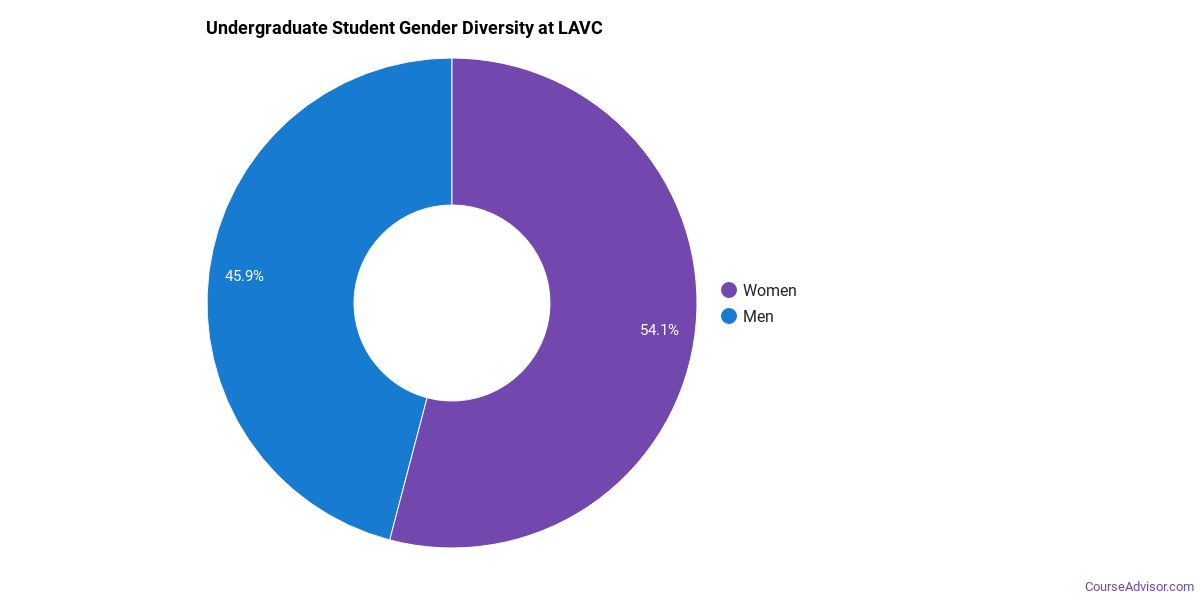
Gender Diversity
Of the 12,470 undergraduate students at LA Valley College, approximately 44% are male and 56% are female.
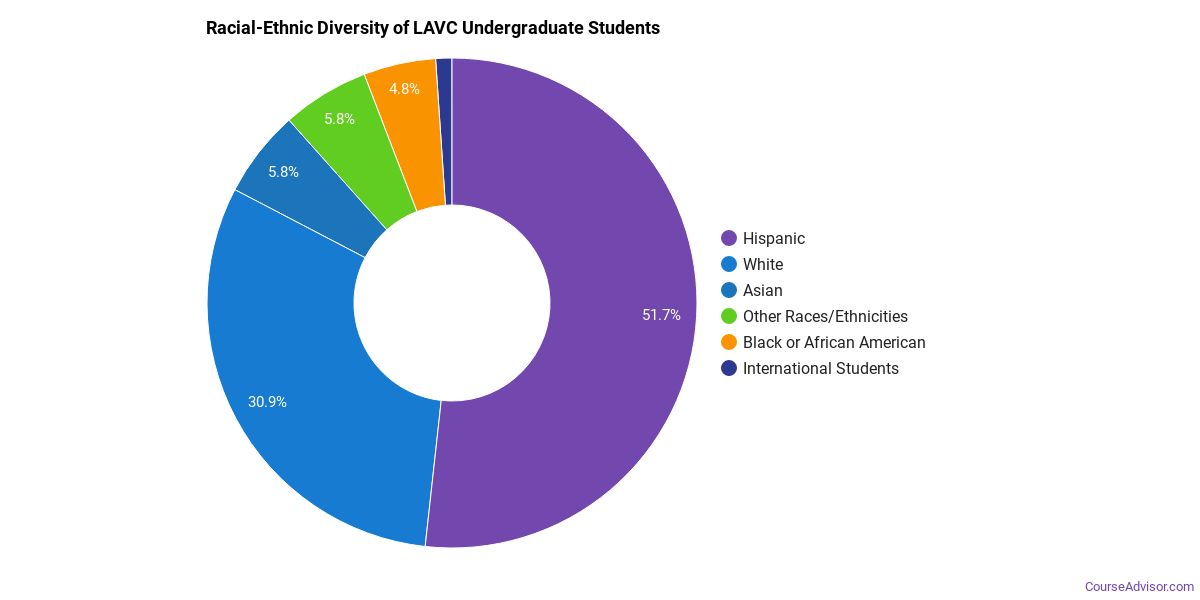
Racial-Ethnic Diversity
The racial-ethnic breakdown of Los Angeles Valley College undergraduate students is as follows.
| Race/Ethnicity | Number of Students |
|---|---|
| Asian | 685 |
| Black or African American | 648 |
| Hispanic | 6,147 |
| White | 4,239 |
| American Indian/Alaska Native | 12 |
| Native Hawaiian/Pacific Islander | 12 |
| Two or More Races | 336 |
| Non-Resident | 49 |
Geographic Diversity
The top 5 home states of first-time undergraduate students at LA Valley College are listed below.

| State | First-Time UG Students |
|---|---|
| California | 2,564 |
Additionally, approximately 0.4% of undergraduate students are non-resident from outside the United States.
Online Learning at Los Angeles Valley College
LA Valley College offers online programs for students who need flexibility.
3,372 undergraduate students at LA Valley College took at least one online class — of those, 9,425 took all of their classes online.
Distance education is available at the undergraduate level.
Science & Tech Programs at Los Angeles Valley College
Below are the science & tech programs are offered at LA Valley College, with the number of degrees awarded at each level in the most recent reporting year.
| Program | Bachelor’s | Master’s | Doctorate | Total |
|---|---|---|---|---|
| Architectural Sciences and Technology | — | — | — | 2 |
Academic Programs at Los Angeles Valley College
LA Valley College offers 29 distinct academic programs.
The highest level of award offered is Bachelor’s degree.
Institutional Profile
LA Valley College has an open admission policy: Yes. Credit transfer:
- AP credits: Implied no
- Dual enrollment credits: Yes
- Life experience credits: Implied no
References
More about our data sources and methodologies.
Course Advisor provides higher-education, college and university, degree, program, career, salary, and other helpful information to students, faculty, institutions, and other internet audiences. Presented information and data are subject to change. Inclusion on this website does not imply or represent a direct relationship with the company, school, or brand. Information, though believed correct at time of publication, may not be correct, and no warranty is provided. Contact the schools to verify any information before relying on it. Financial aid may be available for those who qualify. The displayed options may include sponsored or recommended results, not necessarily based on your preferences.
© Course Advisor – All Rights Reserved.