Lorain County Joint Vocational School District Overview
Lorain County Joint Vocational School District is a public institution located in Oberlin, Ohio. The rural area surrounding the school is great for students who prefer living in a country setting.
What Is Lorain County Joint Vocational School District Known For?
- Lorain County Joint Vocational School District has an impressive student to faculty ratio of 8 to 1.
- The 3% student loan default rate at Lorain County Joint Vocational School District is better than the national rate of 10.1%. That's a good sign that you may be able to pay off student loans easier than your peers at other schools can.
- The highest award offered at Lorain County Joint Vocational School District is the undergraduate certificate.
Where Is Lorain County Joint Vocational School District?
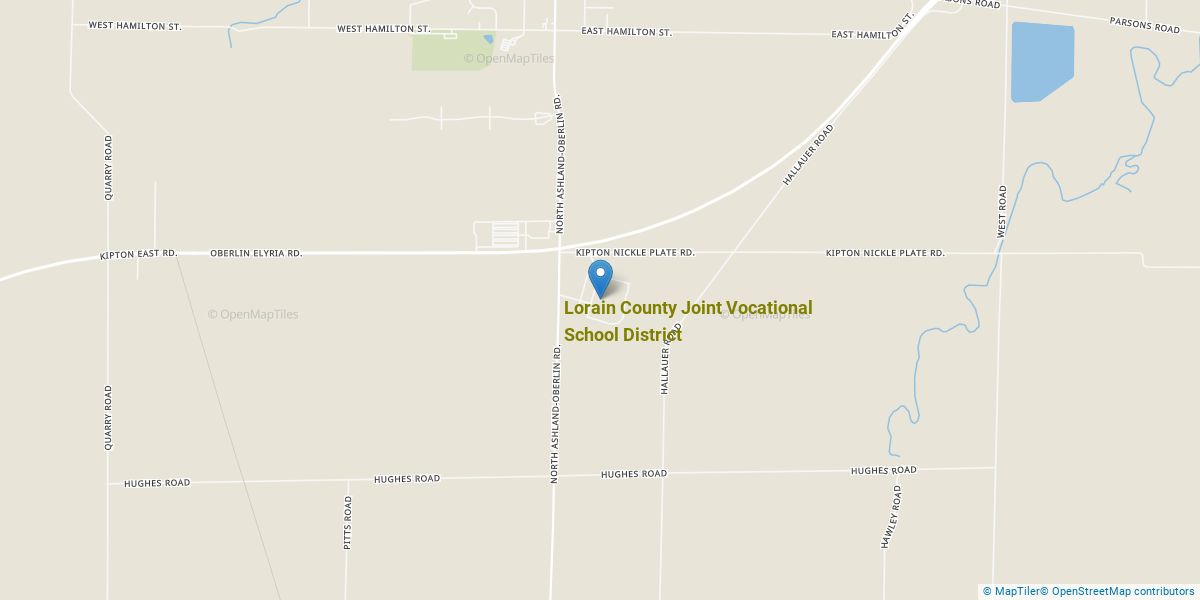
Contact details for Lorain County Joint Vocational School District are given below.
| Contact Details | |
|---|---|
| Address: | 15181 St Rte 58 S, Oberlin, OH 44074 |
| Phone: | 440-774-1051 |
| Website: | www.lcjvs.com |
Can I Afford Lorain County Joint Vocational School District?
Student Loan Debt
While almost two-thirds of students nationwide take out loans to pay for college, the percentage may be quite different for the school you plan on attending. At Lorain County Joint Vocational School District, approximately 30% of students took out student loans averaging $3,203 a year. That adds up to $12,812 over four years for those students.
The student loan default rate at Lorain County Joint Vocational School District is 2.9%. This is significantly lower than the national default rate of 10.1%, which is a good sign that you'll be able to pay back your student loans.
Explore Best Ranked Schools for You
Lorain County Joint Vocational School District Undergraduate Student Diversity
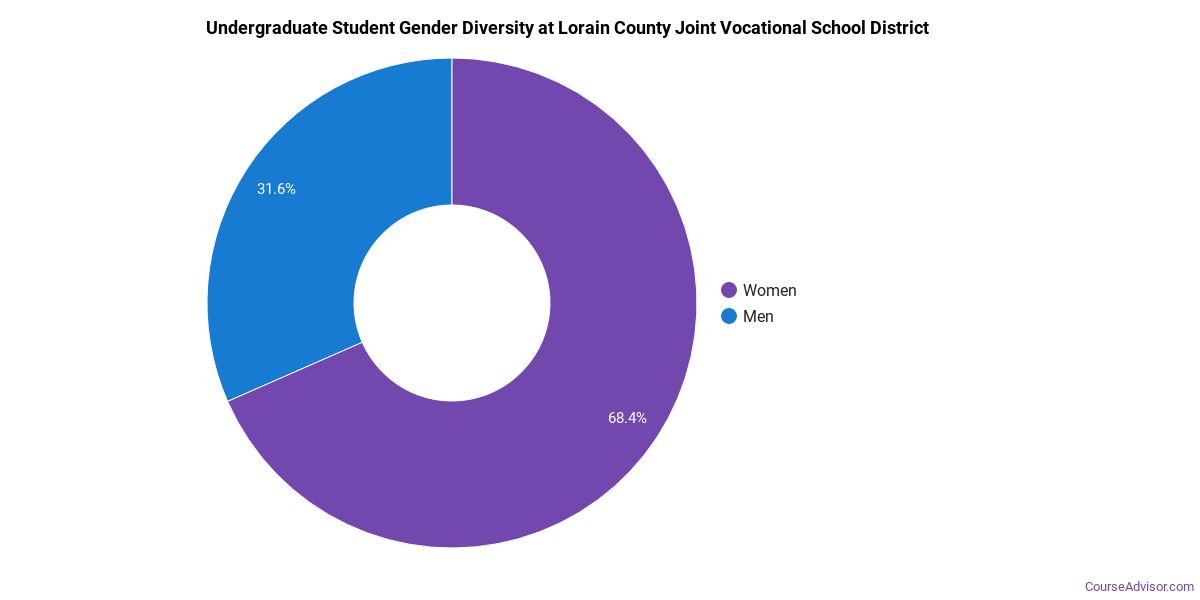
Gender Diversity
Of the 22 full-time undergraduates at Lorain County Joint Vocational School District, 5% are male and 95% are female.
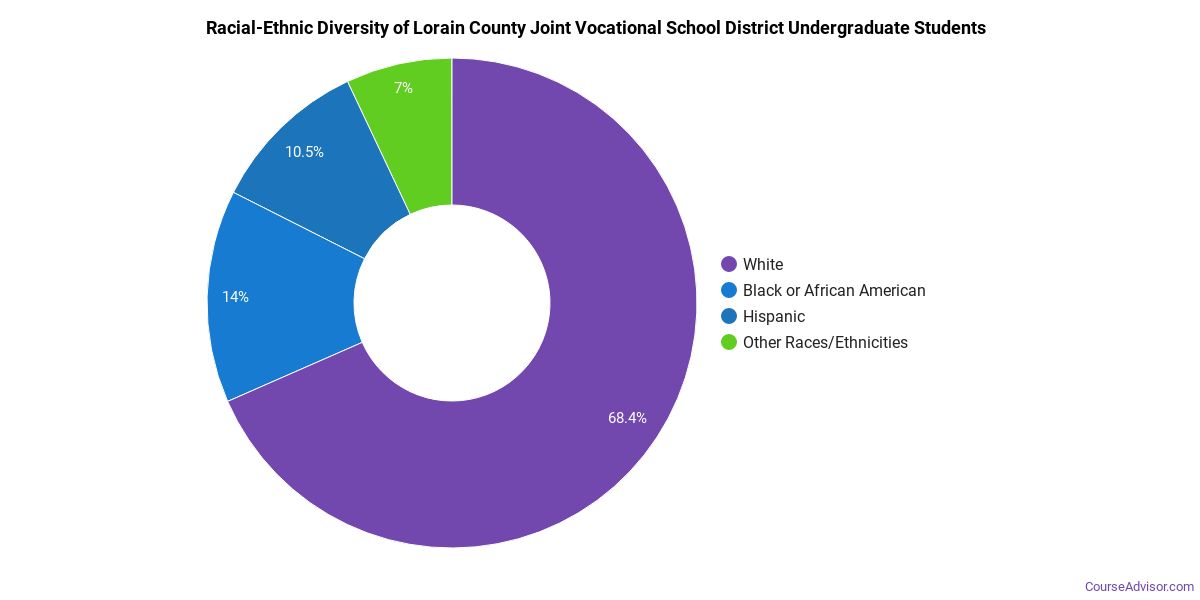
Racial-Ethnic Diversity
The racial-ethnic breakdown of Lorain County Joint Vocational School District students is as follows.
| Race/Ethnicity | Number of Grads |
|---|---|
| Asian | 0 |
| Black or African American | 1 |
| Hispanic or Latino | 3 |
| White | 17 |
| International Students | 0 |
| Other Races/Ethnicities | 1 |
Lorain County Joint Vocational School District Undergraduate Concentrations
The table below shows the number of awards for each concentration.
| Major | Basic Certificate | TOTAL |
|---|---|---|
| Cosmetology | 45 | 45 |
| Practical Nursing & Nursing Assistants | 15 | 15 |
| Dental Support Services | 13 | 13 |
| Precision Metal Working | 13 | 13 |
| Clinical/Medical Laboratory Science | 8 | 8 |
| Vehicle Maintenance & Repair | 7 | 7 |
| TOTAL | 101 | 101 |
References
*The racial-ethnic minorities count is calculated by taking the total number of students and subtracting white students, international students, and students whose race/ethnicity was unknown. This number is then divided by the total number of students at the school to obtain the racial-ethnic minorities percentage.
More about our data sources and methodologies.
Course Advisor provides higher-education, college and university, degree, program, career, salary, and other helpful information to students, faculty, institutions, and other internet audiences. Presented information and data are subject to change. Inclusion on this website does not imply or represent a direct relationship with the company, school, or brand. Information, though believed correct at time of publication, may not be correct, and no warranty is provided. Contact the schools to verify any information before relying on it. Financial aid may be available for those who qualify. The displayed options may include sponsored or recommended results, not necessarily based on your preferences.
© Course Advisor – All Rights Reserved.