Lindsey Hopkins Technical College Overview
Located in Miami, Florida, Lindsey Hopkins Technical College is a public institution. The surrounding area of the school is a good match for students who enjoy city life.
What Is Lindsey Hopkins Technical College Known For?
- The undergraduate certificate is the highest award offered at Lindsey Hopkins Technical College.
Where Is Lindsey Hopkins Technical College?
Contact details for Lindsey Hopkins Technical College are given below.
| Contact Details | |
|---|---|
| Address: | 750 Nw 20 Street, Miami, FL 33127 |
| Phone: | 305-324-6070 |
| Website: | www.lindseyhopkins.edu |
Can I Afford Lindsey Hopkins Technical College?
Explore Best Ranked Schools for You
Lindsey Hopkins Technical College Undergraduate Student Diversity
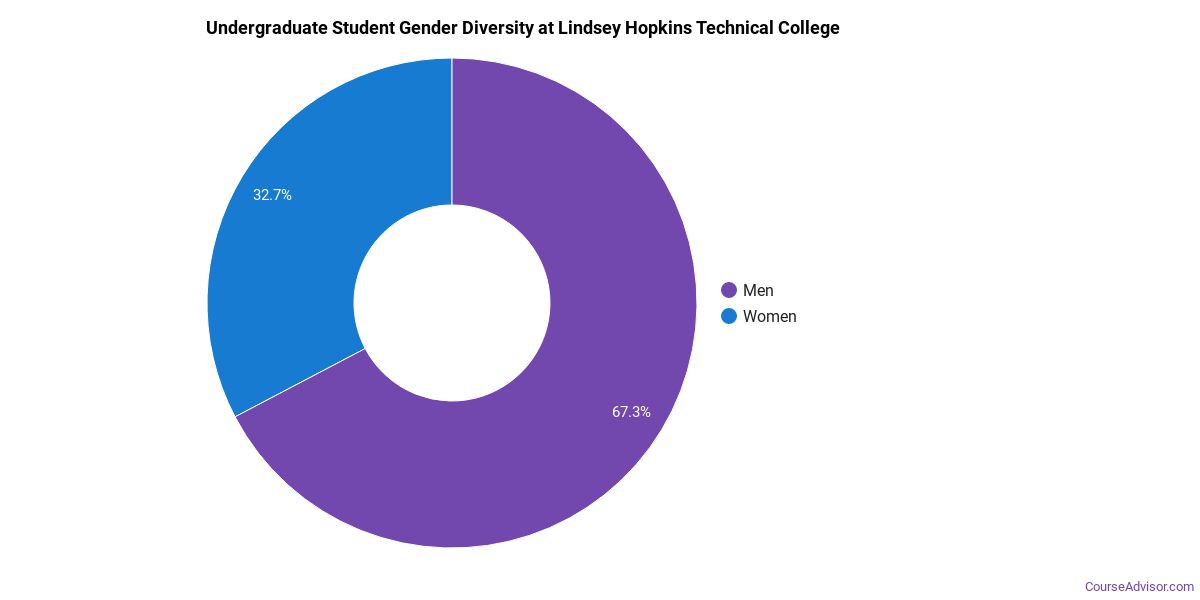
Gender Diversity
Of the 302 full-time undergraduates at Lindsey Hopkins Technical College, 54% are male and 46% are female.
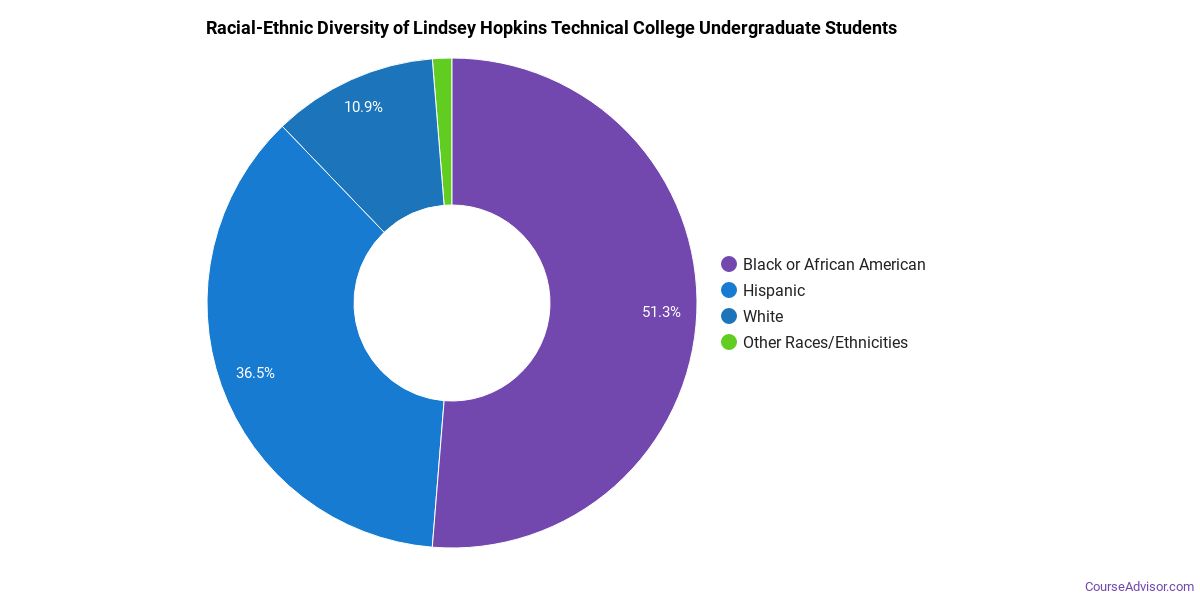
Racial-Ethnic Diversity
The racial-ethnic breakdown of Lindsey Hopkins Technical College students is as follows.
| Race/Ethnicity | Number of Grads |
|---|---|
| Asian | 1 |
| Black or African American | 152 |
| Hispanic or Latino | 80 |
| White | 58 |
| International Students | 4 |
| Other Races/Ethnicities | 7 |
Lindsey Hopkins Technical College Undergraduate Concentrations
The table below shows the number of awards for each concentration.
| Major | Basic Certificate | Undergraduate Certificate | TOTAL |
|---|---|---|---|
| Housing | 57 | 0 | 57 |
| Cosmetology | 56 | 0 | 56 |
| Dietetics & Clinical Nutrition Services | 38 | 0 | 38 |
| Practical Nursing & Nursing Assistants | 2 | 18 | 20 |
| Vehicle Maintenance & Repair | 0 | 20 | 20 |
| Electrical & Power Transmission Installers | 0 | 19 | 19 |
| Clinical/Medical Laboratory Science | 13 | 0 | 13 |
| Allied Health Professions | 0 | 8 | 8 |
| Culinary Arts | 0 | 8 | 8 |
| Dental Support Services | 0 | 7 | 7 |
| Computer Systems Networking | 0 | 5 | 5 |
| Environmental Control Technology | 0 | 5 | 5 |
| Design & Applied Arts | 0 | 5 | 5 |
| Electromechanical Engineering Technology | 0 | 2 | 2 |
| Human Development & Family Studies | 1 | 0 | 1 |
| TOTAL | 167 | 97 | 264 |
References
*The racial-ethnic minorities count is calculated by taking the total number of students and subtracting white students, international students, and students whose race/ethnicity was unknown. This number is then divided by the total number of students at the school to obtain the racial-ethnic minorities percentage.
More about our data sources and methodologies.
Course Advisor provides higher-education, college and university, degree, program, career, salary, and other helpful information to students, faculty, institutions, and other internet audiences. Presented information and data are subject to change. Inclusion on this website does not imply or represent a direct relationship with the company, school, or brand. Information, though believed correct at time of publication, may not be correct, and no warranty is provided. Contact the schools to verify any information before relying on it. Financial aid may be available for those who qualify. The displayed options may include sponsored or recommended results, not necessarily based on your preferences.
© Course Advisor – All Rights Reserved.