Ethnic Studies at Indiana University-Bloomington
If you are interested in studying Ethnic Studies, take a look at what Indiana University-Bloomington. Get started with the following essential facts.
Indiana University-Bloomington sits in Bloomington, IN.
For the most recent IPEDS reporting year, 42 ethnic studies degrees were awarded at Indiana University-Bloomington.
Featured schools near , edit
Online & Distance Learning at Indiana University-Bloomington
Many students take online classes at Indiana University-Bloomington. Of 48,424 students, 3,249 (7%) studied exclusively online and 17,945 (37%) took at least some classes online.
Ethnic Studies Rankings at Indiana University-Bloomington
Use these rankings to compare Indiana University-Bloomington’s Ethnic Studies program against peer institutions.
Bachelor’s-Level Rankings
| Ranking | Scope | Rank |
|---|---|---|
| Best Schools (Quality) | Indiana | #2 of 2 |
| Best Value | Indiana | #2 of 2 |
| Best Value | Great Lakes (Region) | #10 of 22 |
| Best Schools (Quality) | Great Lakes (Region) | #11 of 22 |
| Best Schools (Quality) | Nationwide | #59 of 143 |
| Best Value | Nationwide | #65 of 142 |
Master’s-Level Rankings
| Ranking | Scope | Rank |
|---|---|---|
| Best Schools (Quality) | Indiana | #2 of 2 |
| Best Value | Indiana | #2 of 2 |
| Best Value | Great Lakes (Region) | #10 of 22 |
| Best Schools (Quality) | Great Lakes (Region) | #11 of 22 |
| Best Schools (Quality) | Nationwide | #59 of 143 |
| Best Value | Nationwide | #65 of 142 |
Doctoral-Level Rankings
| Ranking | Scope | Rank |
|---|---|---|
| Best Schools (Quality) | Indiana | #2 of 2 |
| Best Value | Indiana | #2 of 2 |
| Best Value | Great Lakes (Region) | #10 of 22 |
| Best Schools (Quality) | Great Lakes (Region) | #11 of 22 |
| Best Schools (Quality) | Nationwide | #59 of 143 |
| Best Value | Nationwide | #65 of 142 |
Earnings for Ethnic Studies Graduates from Indiana University-Bloomington
Students who complete Indiana University-Bloomington’s Ethnic Studies program earn at the following median levels (per the U.S. Department of Education’s College Scorecard):
| Years After Graduation | Median Earnings |
|---|---|
| 1 year | $31,316 |
| 2 years | $20,140 |
| 3 years | $32,652 |
| 4 years | $41,084 |
| 5 years | $49,207 |
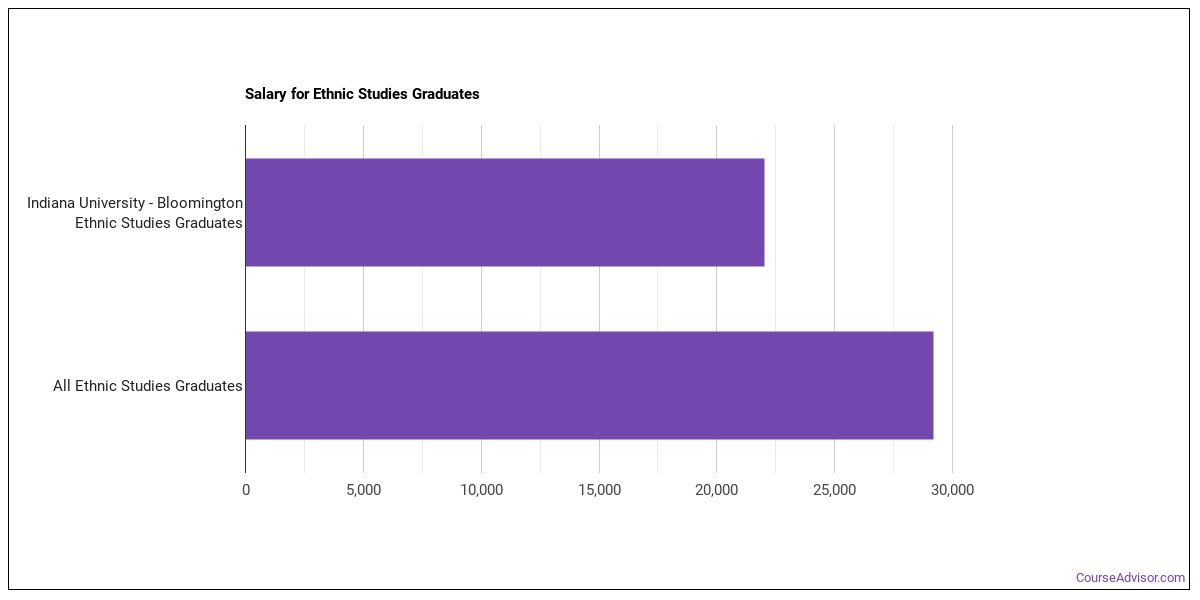
How does this compare to the school overall? At the four-year mark, Ethnic Studies graduates from Indiana University-Bloomington take home a median $41,084, compared with $74,553 for all Indiana University-Bloomington graduates — about 45% lower than the school-wide median.

Median Debt at Graduation
Median student loan debt for Ethnic Studies graduates from Indiana University-Bloomington is $17,500.
Student Demographics & Diversity
Below you’ll find the diversity of Ethnic Studies graduates at Indiana University-Bloomington, broken down by degree level.
Across all degree levels, Ethnic Studies graduates at Indiana University-Bloomington are 74% women (31) and 26% men (11).
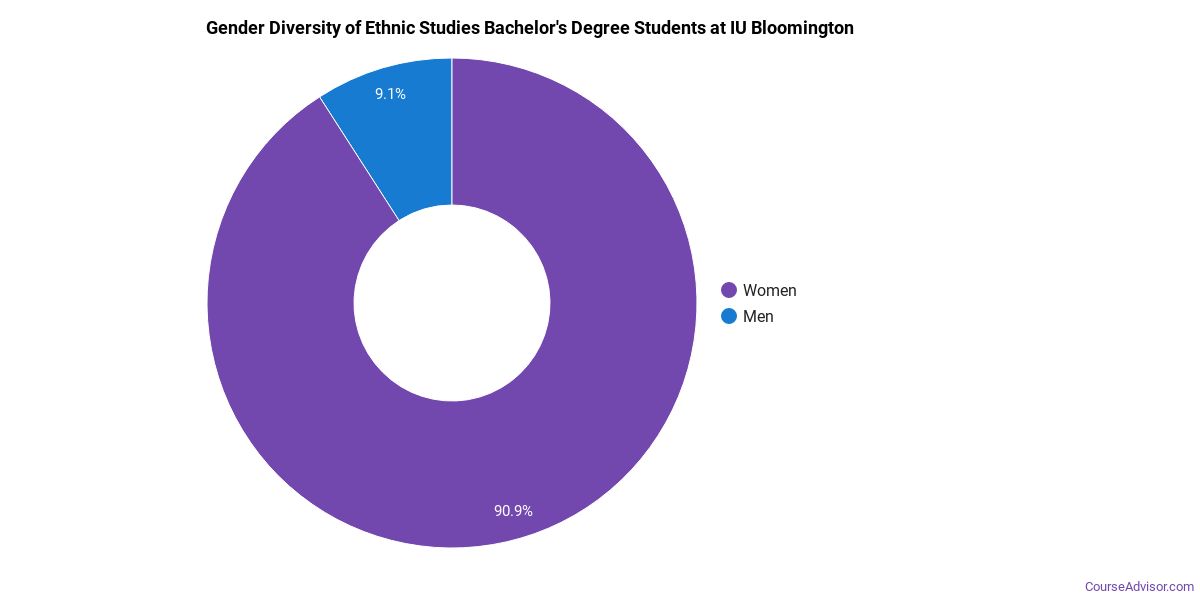
Ethnic Studies Bachelor’s Program at Indiana University-Bloomington
Among the 20 bachelor’s ethnic studies graduates at Indiana University-Bloomington, 90% were women (18) and 10% were men (2).
The following table and chart show the race/ethnicity of Ethnic Studies bachelor’s degree recipients at Indiana University-Bloomington.
| Race / Ethnicity | Number of Graduates |
|---|---|
| White | 13 |
| Hispanic / Latino | 1 |
| Black / African American | 4 |
| Asian | 1 |
| Two or More Races | 1 |
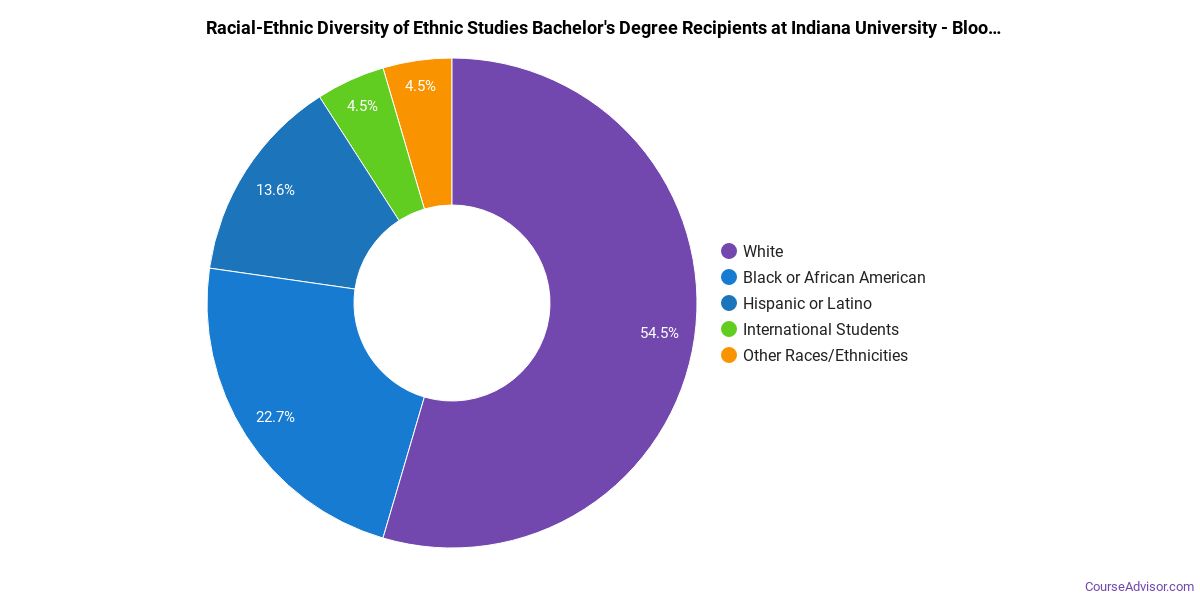
Racial-ethnic minorities make up 35% of Ethnic Studies bachelor’s degree recipients at Indiana University-Bloomington, below the national average of 66%.*
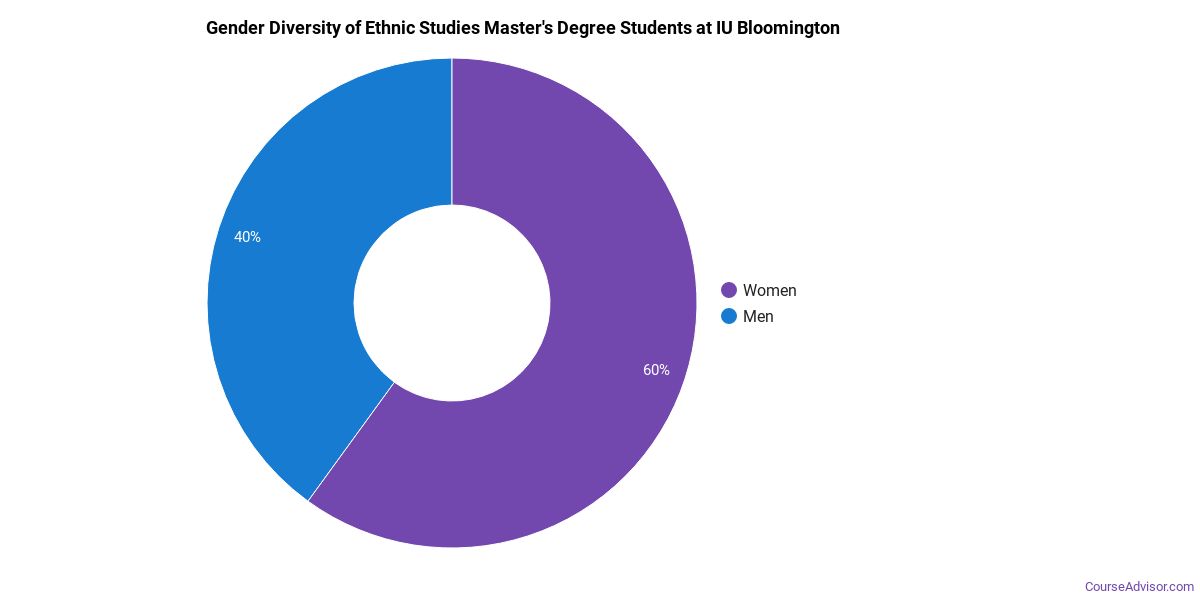
Ethnic Studies Master’s Program at Indiana University-Bloomington
Of the 12 master’s ethnic studies graduates at Indiana University-Bloomington, 67% were women (8) and 33% were men (4).
The following table and chart show the race/ethnicity of Ethnic Studies master’s degree recipients at Indiana University-Bloomington.
| Race / Ethnicity | Number of Graduates |
|---|---|
| White | 5 |
| Black / African American | 6 |
| Asian | 1 |
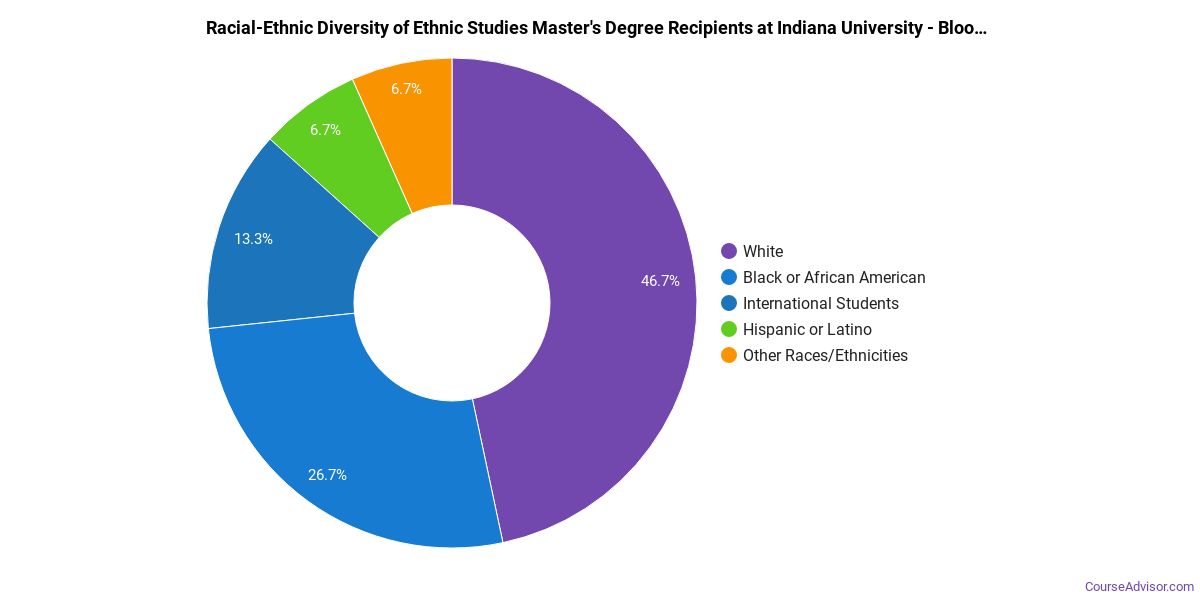
Minority students account for 58% of Ethnic Studies master’s degree recipients at Indiana University-Bloomington, below the national average of 60%.*
Ethnic Studies Doctoral Program at Indiana University-Bloomington
Among the 10 doctoral ethnic studies degrees awarded at Indiana University-Bloomington, 50% were women (5) and 50% were men (5).

The following table and chart show the race/ethnicity of Ethnic Studies doctoral degree recipients at Indiana University-Bloomington.
| Race / Ethnicity | Number of Graduates |
|---|---|
| White | 7 |
| Black / African American | 2 |
| International (Nonresident) | 1 |

Racial-ethnic minorities make up 20% of Ethnic Studies doctoral degree recipients at Indiana University-Bloomington, lower than the national average of 60%.*
*The racial-ethnic minorities figure is the total number of graduates minus White, international (nonresident), and unknown-race graduates.
More Specific Ethnic Studies Concentrations at Indiana University-Bloomington
This Ethnic Studies program at Indiana University-Bloomington breaks down into more specific concentrations:
| Concentration | Graduates |
|---|---|
| African American Studies | 9 |
| Folklore Studies | 20 |
| Other Ethnic Studies | 13 |
Top-Paying Careers for Ethnic Studies Graduates
Graduates of the Ethnic Studies program at Indiana University-Bloomington work across a variety of fields. The table below ranks the top-paying careers for Ethnic Studies graduates, ordered by median annual salary:
| Occupation | Nationwide Median Wage |
|---|---|
| Interpreters and Translators | $52,627 |
| Area, Ethnic, and Cultural Studies Teachers, Postsecondary | $47,517 |
References
- IPEDS — Integrated Postsecondary Education Data System
- U.S. Department of Education — College Scorecard
- O*NET Online (Bureau of Labor Statistics)
- National Center for Education Statistics
More about our data sources and methodologies.
Course Advisor provides higher-education, college and university, degree, program, career, salary, and other helpful information to students, faculty, institutions, and other internet audiences. Presented information and data are subject to change. Inclusion on this website does not imply or represent a direct relationship with the company, school, or brand. Information, though believed correct at time of publication, may not be correct, and no warranty is provided. Contact the schools to verify any information before relying on it. Financial aid may be available for those who qualify. The displayed options may include sponsored or recommended results, not necessarily based on your preferences.
© Course Advisor – All Rights Reserved.