Wabash Valley College Overview
Located in Mount Carmel, Illinois, Wabash Valley College is a public institution. The charming, small-town atmosphere of Mount Carmel draws many to the area.
What Is Wabash Valley College Known For?
- Although it may not be available for every major, the associate's degree is the highest award a student can attain at Wabash Valley College.
- In a recent academic period34% of the faculty were full-time.
Where Is Wabash Valley College?
Contact details for Wabash Valley College are given below.
| Contact Details | |
|---|---|
| Address: | 2200 College Drive, Mount Carmel, IL 62863 |
| Phone: | 618-393-2982 |
| Website: | www.iecc.edu |
How Do I Get Into Wabash Valley College?
You can apply to Wabash Valley College online at: https://www.iecc.edu/application
Can I Afford Wabash Valley College?
Student Loan Debt
It's not uncommon for college students to take out loans to pay for school. In fact, almost 66% of students nationwide depend at least partially on loans. At Wabash Valley College, approximately 10% of students took out student loans averaging $5,382 a year. That adds up to $21,528 over four years for those students.
Explore Best Ranked Schools for You
Wabash Valley College Undergraduate Student Diversity
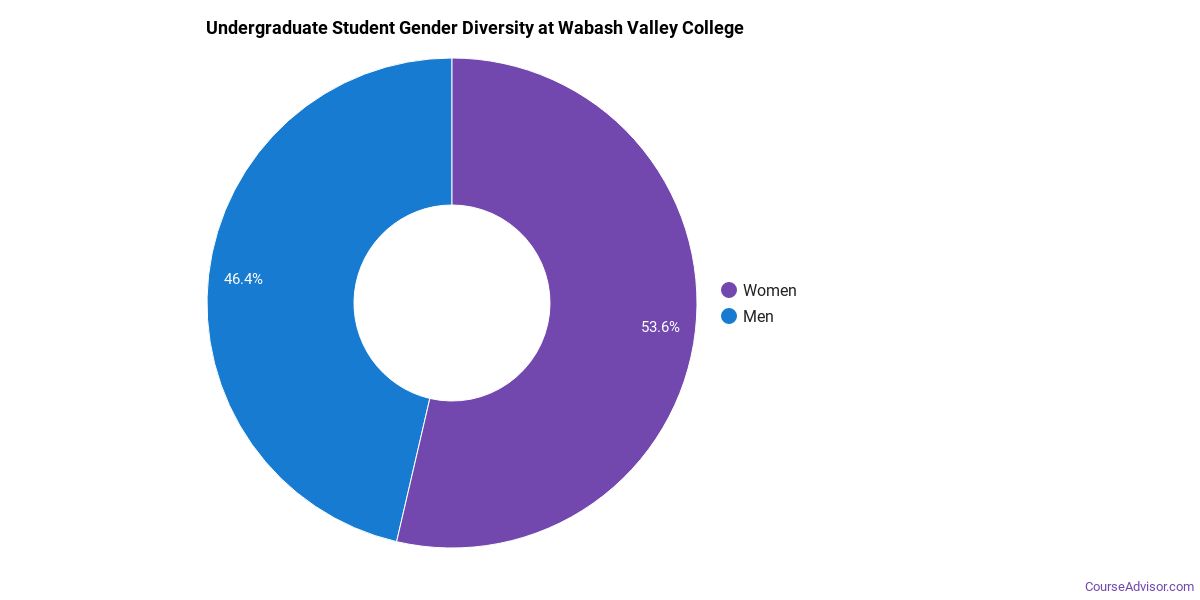
Gender Diversity
Of the 432 full-time undergraduates at Wabash Valley College, 47% are male and 53% are female.
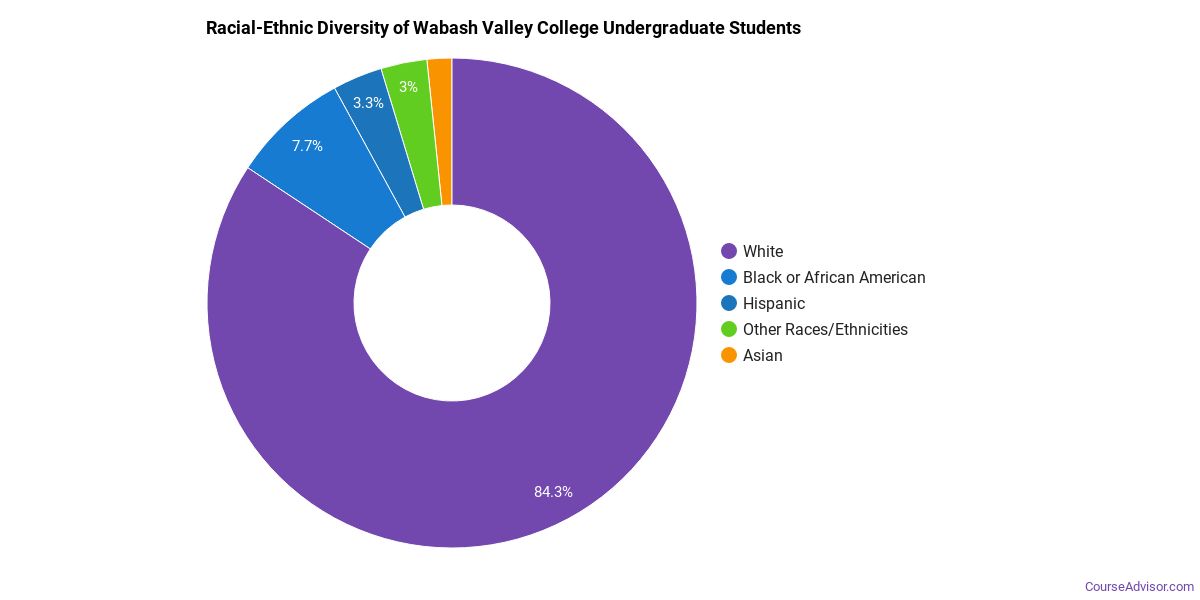
Racial-Ethnic Diversity
The racial-ethnic breakdown of Wabash Valley College students is as follows.
| Race/Ethnicity | Number of Grads |
|---|---|
| Asian | 4 |
| Black or African American | 30 |
| Hispanic or Latino | 19 |
| White | 369 |
| International Students | 0 |
| Other Races/Ethnicities | 10 |
Wabash Valley College Undergraduate Concentrations
The table below shows the number of awards for each concentration.
| Major | Basic Certificate | Associate’s | Undergraduate Certificate | TOTAL |
|---|---|---|---|---|
| Liberal Arts General Studies | 0 | 85 | 48 | 133 |
| Practical Nursing & Nursing Assistants | 24 | 0 | 0 | 24 |
| Ground Transportation | 24 | 0 | 0 | 24 |
| Biological & Physical Science | 0 | 20 | 0 | 20 |
| Agricultural Economics & Business | 0 | 14 | 0 | 14 |
| Entrepreneurial Studies | 14 | 0 | 0 | 14 |
| Agricultural Production | 0 | 13 | 0 | 13 |
| Health Sciences & Services | 12 | 0 | 0 | 12 |
| Social Work | 0 | 7 | 0 | 7 |
| Human Development & Family Studies | 0 | 6 | 0 | 6 |
| Audiovisual Communications | 0 | 4 | 0 | 4 |
| Vehicle Maintenance & Repair | 0 | 4 | 0 | 4 |
| General Sales & Marketing | 0 | 3 | 0 | 3 |
| Precision Metal Working | 0 | 1 | 2 | 3 |
| Industrial Production Technology | 0 | 1 | 0 | 1 |
| Horticulture | 0 | 0 | 0 | 0 |
| Business Support & Assistant Services | 0 | 0 | 0 | 0 |
| Real Estate | 0 | 0 | 0 | 0 |
| Public Relations & Advertising | 0 | 0 | 0 | 0 |
| Construction | 0 | 0 | 0 | 0 |
| Teaching Assistants | 0 | 0 | 0 | 0 |
| Mining & Petroleum Technology | 0 | 0 | 0 | 0 |
| Health & Medical Administrative Services | 0 | 0 | 0 | 0 |
| Nursing | 0 | 0 | 0 | 0 |
| Legal Support Services | 0 | 0 | 0 | 0 |
| Health & Physical Education | 0 | 0 | 0 | 0 |
| TOTAL | 74 | 158 | 50 | 282 |
References
*The racial-ethnic minorities count is calculated by taking the total number of students and subtracting white students, international students, and students whose race/ethnicity was unknown. This number is then divided by the total number of students at the school to obtain the racial-ethnic minorities percentage.
More about our data sources and methodologies.
Course Advisor provides higher-education, college and university, degree, program, career, salary, and other helpful information to students, faculty, institutions, and other internet audiences. Presented information and data are subject to change. Inclusion on this website does not imply or represent a direct relationship with the company, school, or brand. Information, though believed correct at time of publication, may not be correct, and no warranty is provided. Contact the schools to verify any information before relying on it. Financial aid may be available for those who qualify. The displayed options may include sponsored or recommended results, not necessarily based on your preferences.
© Course Advisor – All Rights Reserved.