Haverford College Science & Tech Programs
Haverford College is a private not-for-profit institution located in Haverford, PA. The Suburbs Of A Large City provides a peaceful environment near the excitement of urban amenities.
Featured schools near , edit
Haverford College Rankings
Haverford College appears in the following rankings for science & tech programs at the bachelors level:
| Ranking | Rank | Among |
|---|---|---|
| Overall Quality | #660 of 4,630 | Nationwide |
Where Is Haverford College?
Contact details for Haverford College are listed below.
| Contact Details | |
|---|---|
| Address: | 370 Lancaster Ave, Haverford, PA 19041-1392 |
| Phone: | 6108961000 |
| Website: | www.haverford.edu/ |
| Admissions: | www.haverford.edu/admission/ |
| Financial Aid: | www.haverford.edu/financial-aid |
How Do I Get Into Haverford College?
You can apply to Haverford College online at: https://www.haverford.edu/admission/applying
Haverford College is classified as Highly Selective (10-20%) for admissions.
Admission Requirements for Haverford College
These are the things Haverford College requires for admission:
| Requirement | Status |
|---|---|
| Secondary School Record | Required |
| Secondary School GPA | Considered but not required |
| Recommendations | Required |
| Admission Test Scores (SAT/ACT) | Considered but not required |
How Hard Is It To Get Into Haverford College?
Haverford College maintains an acceptance rate of 12%, which makes it very selective and competitive. Ensure you meet all application requirements and prepare the application in full.
Of those admitted, 43% choose to enroll — a strong indicator that admitted students commit to enrolling.
Average Test Scores
39% of admitted students submitted SAT scores and 17% submitted ACT scores.
When looking at the 25th through the 75th percentile of admitted students at Haverford College, SAT Evidence-Based Reading and Writing scores ranged between 720 and 770. Math scores were between 740 and 780.
Selectivity by Gender
Admit rates at Haverford College can differ by gender.
| Gender | Applicants | Admitted | Acceptance Rate |
|---|---|---|---|
| Men | 3,631 | 401 | 11% |
| Women | 3,705 | 506 | 14% |
Can I Afford Haverford College?
The average net price after aid at Haverford College is $25,210. Cost varies significantly based on your financial situation since net price varies by income group.
Tuition & Fees
| Category | Cost |
|---|---|
| In-State Tuition | $69,884 |
| In-State Fees | $514 |
| Out-of-State Tuition | $69,884 |
| Out-of-State Fees | $514 |
| Total In-State Tuition & Fees | $70,398 |
| Total Out-of-State Tuition & Fees | $70,398 |
Financial Aid
Counting all forms of financial assistance, 26% of students at Haverford College receive some form of financial aid (373 students).
Nearly 46% of students at Haverford College receive grant or scholarship aid, averaging $65,270 per student.
15% of students receive federal Pell Grants, averaging $5,816.
Student Loan Debt
9% of Haverford College undergraduates take out federal student loans, averaging $5,609 per year.
Haverford College Undergraduate Student Diversity
Its Carnegie Classification is Baccalaureate Colleges: Arts & Sciences Focus.
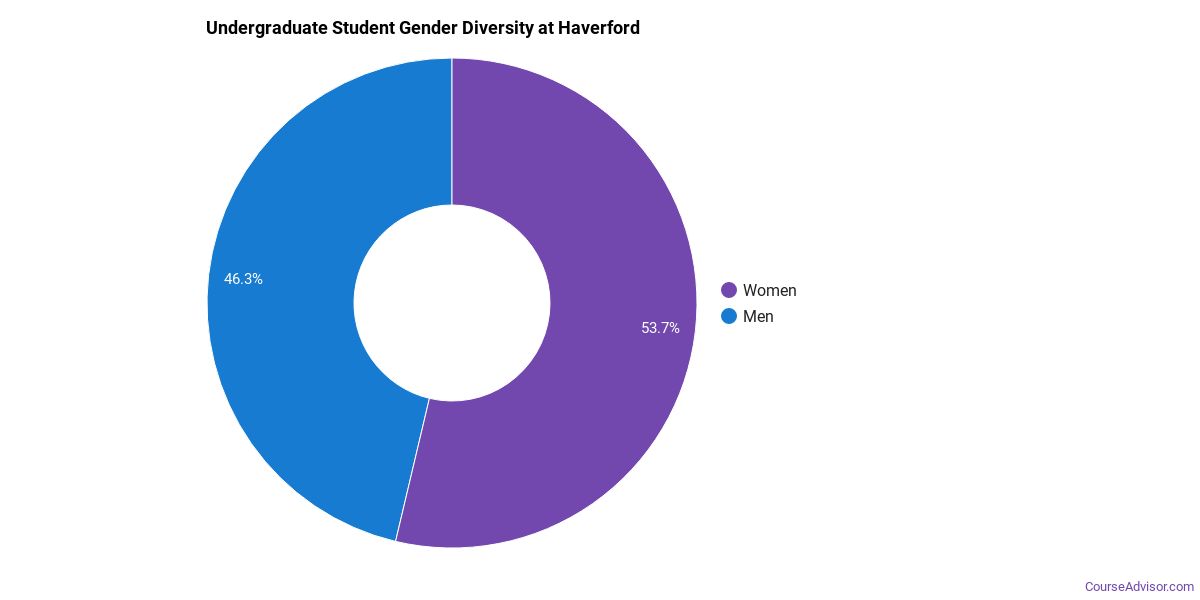
Gender Diversity
Of the 1,421 undergraduate students at Haverford College, approximately 43% are male and 57% are female.
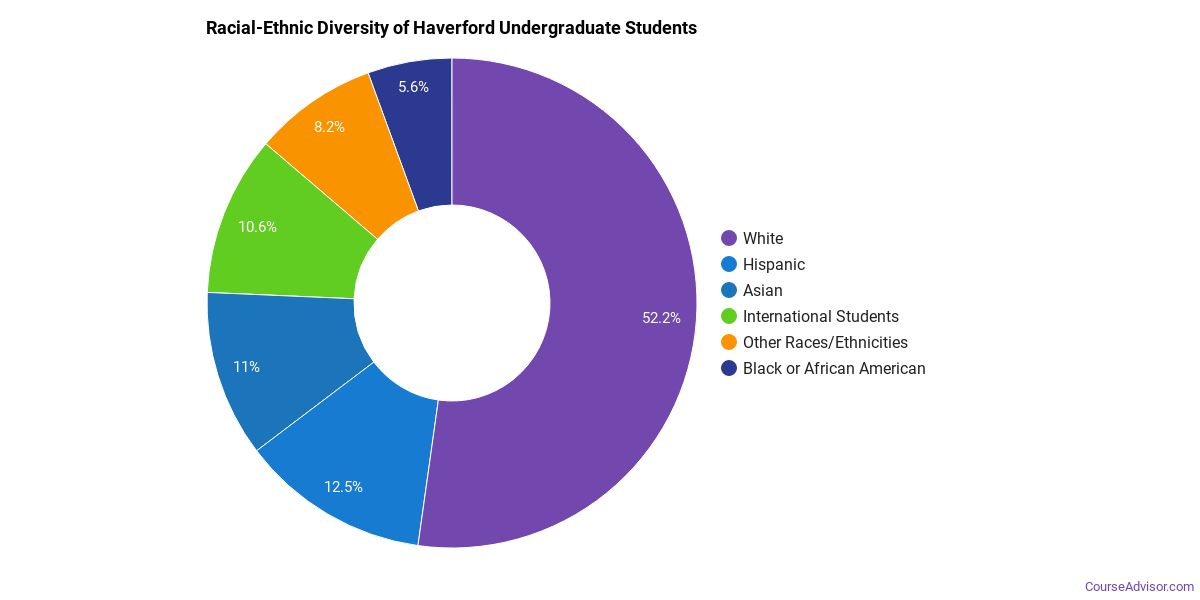
Racial-Ethnic Diversity
The racial-ethnic breakdown of Haverford College undergraduate students is as follows.
| Race/Ethnicity | Number of Students |
|---|---|
| Asian | 183 |
| Black or African American | 62 |
| Hispanic | 163 |
| White | 697 |
| Native Hawaiian/Pacific Islander | 2 |
| Two or More Races | 146 |
| Non-Resident | 156 |
Geographic Diversity
The top 5 home states of first-time undergraduate students at Haverford College are listed below.

| State | First-Time UG Students |
|---|---|
| New York | 54 |
| Pennsylvania | 46 |
| Massachusetts | 35 |
| New Jersey | 35 |
| California | 32 |
Additionally, approximately 11.0% of undergraduate students are non-resident from outside the United States.
Online Learning at Haverford College
Haverford College offers remote learning paths for students who need flexibility.
Academic Programs at Haverford College
Haverford College offers 16 distinct academic programs.
The highest level of award offered is Bachelor’s degree.
Institutional Profile
Haverford College has an open admission policy: No. Credit transfer:
- AP credits: Implied no
- Dual enrollment credits: Yes
- Life experience credits: Implied no
References
More about our data sources and methodologies.
Course Advisor provides higher-education, college and university, degree, program, career, salary, and other helpful information to students, faculty, institutions, and other internet audiences. Presented information and data are subject to change. Inclusion on this website does not imply or represent a direct relationship with the company, school, or brand. Information, though believed correct at time of publication, may not be correct, and no warranty is provided. Contact the schools to verify any information before relying on it. Financial aid may be available for those who qualify. The displayed options may include sponsored or recommended results, not necessarily based on your preferences.
© Course Advisor – All Rights Reserved.