Hacienda La Puente Adult Education Overview
Hacienda La Puente Adult Education is a public institution located in La Puente, California. La Puente is considered a suburb and offers tranquility and safety near the excitement of a city center.
What Is Hacienda La Puente Adult Education Known For?
- The undergraduate certificate is the highest award offered at Hacienda La Puente Adult Education.
- In a recent academic period68% of the faculty were full-time.
Where Is Hacienda La Puente Adult Education?
Contact details for Hacienda La Puente Adult Education are given below.
| Contact Details | |
|---|---|
| Address: | 14101 E. Nelson Ave, La Puente, CA 91746-0002 |
| Phone: | 626-934-2801 |
| Website: | www.hlpae.com |
How Do I Get Into Hacienda La Puente Adult Education?
You can apply to Hacienda La Puente Adult Education online at: https://hlpusd.jotform.com/mtellez/acregform
Admission Requirements for Hacienda La Puente Adult Education
| Submission | Required? |
|---|---|
| High School GPA | 3 |
| High School Rank | 3 |
| High School Transcript | 1 |
| College Prep Program | 3 |
| Recommendations | 3 |
| SAT or ACT Scores | 3 |
| TOEFL | 1 |
How Hard Is It To Get Into Hacienda La Puente Adult Education?
Approximately 35% of accepted students are men and 65% are women. The acceptance rate for men is 92%, and the acceptance rate for women is 95%.
Can I Afford Hacienda La Puente Adult Education?
Explore Best Ranked Schools for You
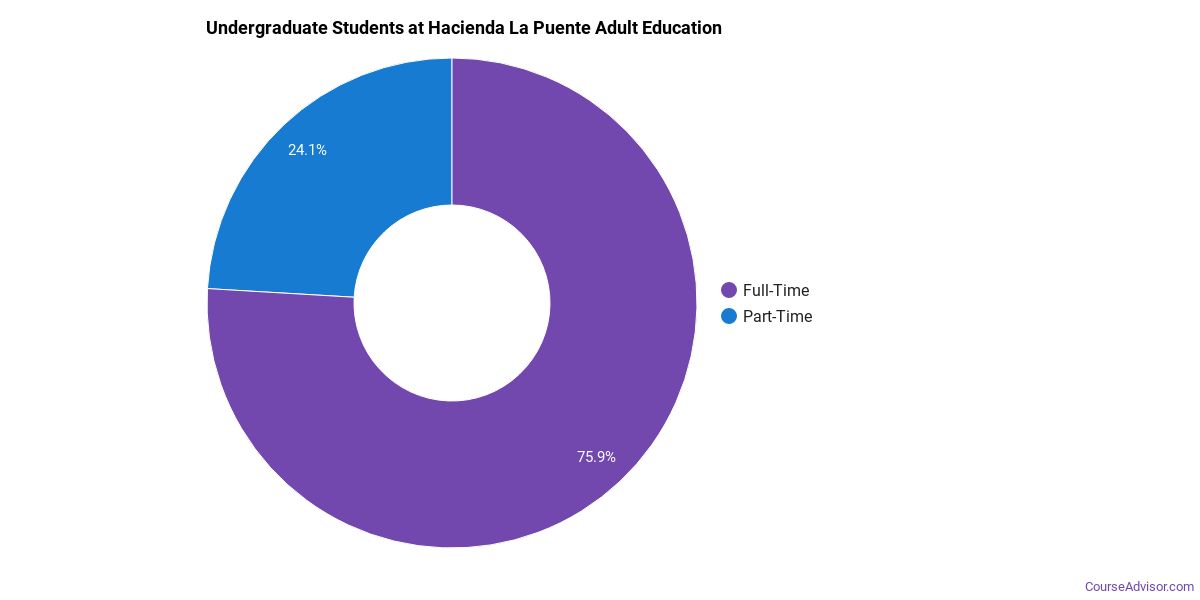
Hacienda La Puente Adult Education Undergraduate Student Diversity
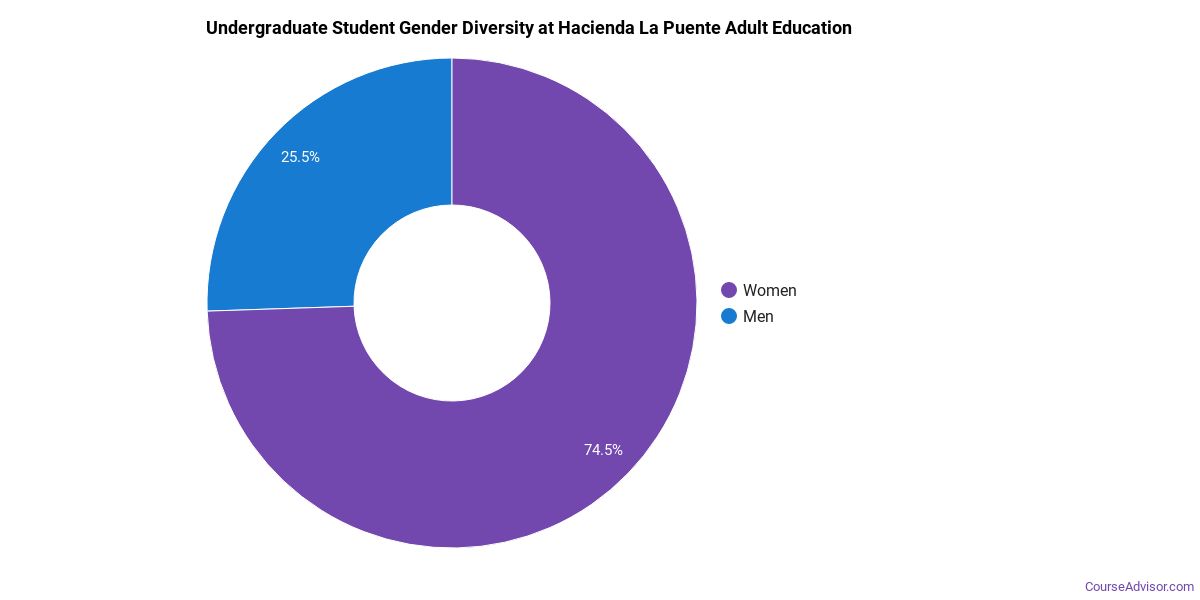
Gender Diversity
Of the 573 full-time undergraduates at Hacienda La Puente Adult Education, 53% are male and 47% are female.
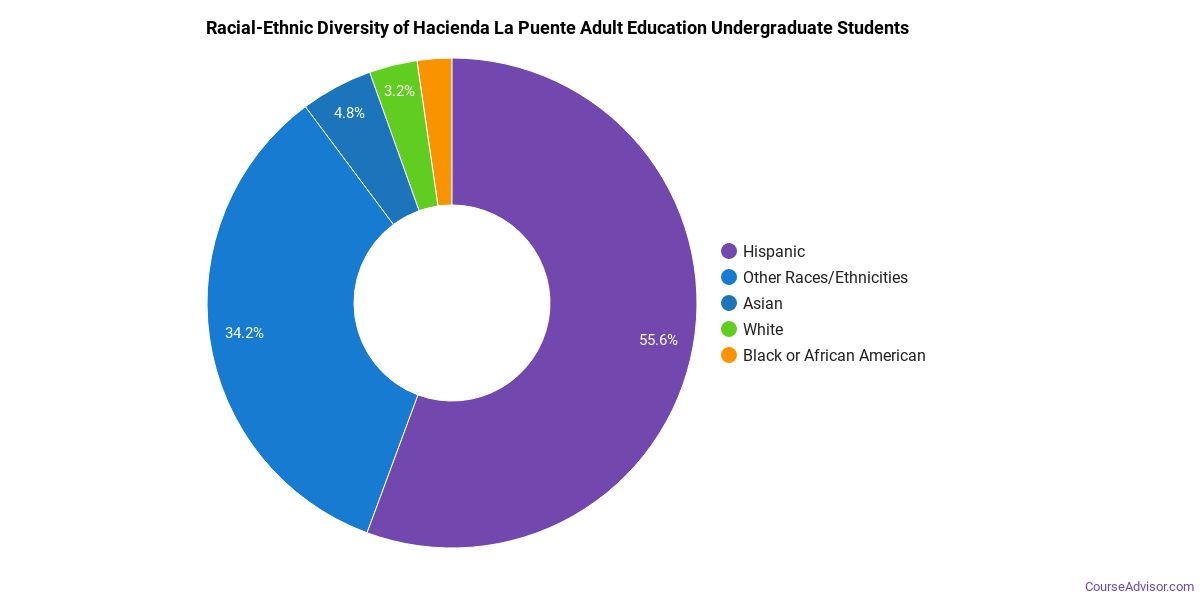
Racial-Ethnic Diversity
The racial-ethnic breakdown of Hacienda La Puente Adult Education students is as follows.
| Race/Ethnicity | Number of Grads |
|---|---|
| Asian | 109 |
| Black or African American | 10 |
| Hispanic or Latino | 371 |
| White | 63 |
| International Students | 0 |
| Other Races/Ethnicities | 20 |
Hacienda La Puente Adult Education Undergraduate Concentrations
The table below shows the number of awards for each concentration.
| Major | Basic Certificate | Undergraduate Certificate | TOTAL |
|---|---|---|---|
| Cosmetology | 156 | 118 | 274 |
| Practical Nursing & Nursing Assistants | 40 | 16 | 56 |
| Health & Medical Administrative Services | 32 | 6 | 38 |
| Business Support & Assistant Services | 20 | 0 | 20 |
| Precision Metal Working | 0 | 16 | 16 |
| Dental Support Services | 0 | 12 | 12 |
| Culinary Arts | 0 | 12 | 12 |
| Allied Health & Medical Assisting Services | 11 | 0 | 11 |
| Heating, Air Conditioning, Ventilation & Refrigeration | 11 | 0 | 11 |
| Mechanical Engineering Technology | 0 | 9 | 9 |
| Electronics Maintenance & Repair | 0 | 9 | 9 |
| Mental & Social Health Services | 0 | 3 | 3 |
| TOTAL | 270 | 201 | 471 |
References
*The racial-ethnic minorities count is calculated by taking the total number of students and subtracting white students, international students, and students whose race/ethnicity was unknown. This number is then divided by the total number of students at the school to obtain the racial-ethnic minorities percentage.
More about our data sources and methodologies.
Course Advisor provides higher-education, college and university, degree, program, career, salary, and other helpful information to students, faculty, institutions, and other internet audiences. Presented information and data are subject to change. Inclusion on this website does not imply or represent a direct relationship with the company, school, or brand. Information, though believed correct at time of publication, may not be correct, and no warranty is provided. Contact the schools to verify any information before relying on it. Financial aid may be available for those who qualify. The displayed options may include sponsored or recommended results, not necessarily based on your preferences.
© Course Advisor – All Rights Reserved.