Romance Languages at Grinnell College
What traits are you looking for in a school for Romance Languages, consider the program at Grinnell College. Get started with the following essential facts.
Grinnell College sits in Grinnell, IA.
During the most recent reporting year, 25 romance languages degrees were awarded at Grinnell College.
Featured schools near , edit
Studying Online at Grinnell College
Grinnell College primarily offers on-campus instruction; distance-education enrollment is limited.
Romance Languages Rankings at Grinnell College
Use these rankings to compare Grinnell College’s Romance Languages program against peer institutions.
Bachelor’s-Level Rankings
| Ranking | Scope | Rank |
|---|---|---|
| Best Schools (Quality) | Iowa | #1 of 3 |
| Best Value | Iowa | #1 of 3 |
| Best Value | The Plains States (Region) | #2 of 15 |
| Best Schools (Quality) | The Plains States (Region) | #5 of 15 |
| Best Schools (Quality) | Nationwide | #65 of 211 |
| Best Value | Nationwide | #108 of 209 |
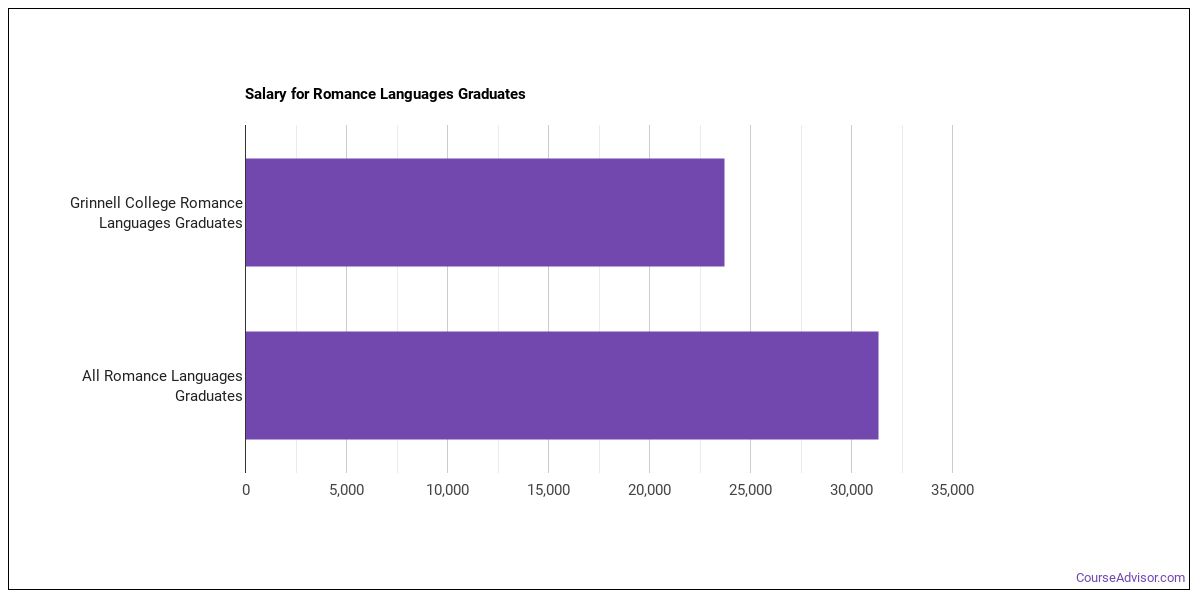
Earnings for Romance Languages Graduates from Grinnell College
Students who complete Grinnell College’s Romance Languages program report the following median earnings (per the U.S. Department of Education’s College Scorecard):
| Years After Graduation | Median Earnings |
|---|---|
| 1 year | $23,718 |
| 2 years | $19,227 |
| 3 years | $29,237 |
| 4 years | $47,618 |
| 5 years | $58,680 |
How does this compare to the school overall? Four years after graduating, Romance Languages graduates from Grinnell College earn a median of $47,618, compared with $64,044 for all Grinnell College graduates — about 26% lower than the school-wide median.

Median Debt at Graduation
Typical debt at graduation for Romance Languages graduates from Grinnell College is $17,814.
Student Demographics & Diversity
Take a look at the student demographics for Romance Languages graduates at Grinnell College, by degree type.
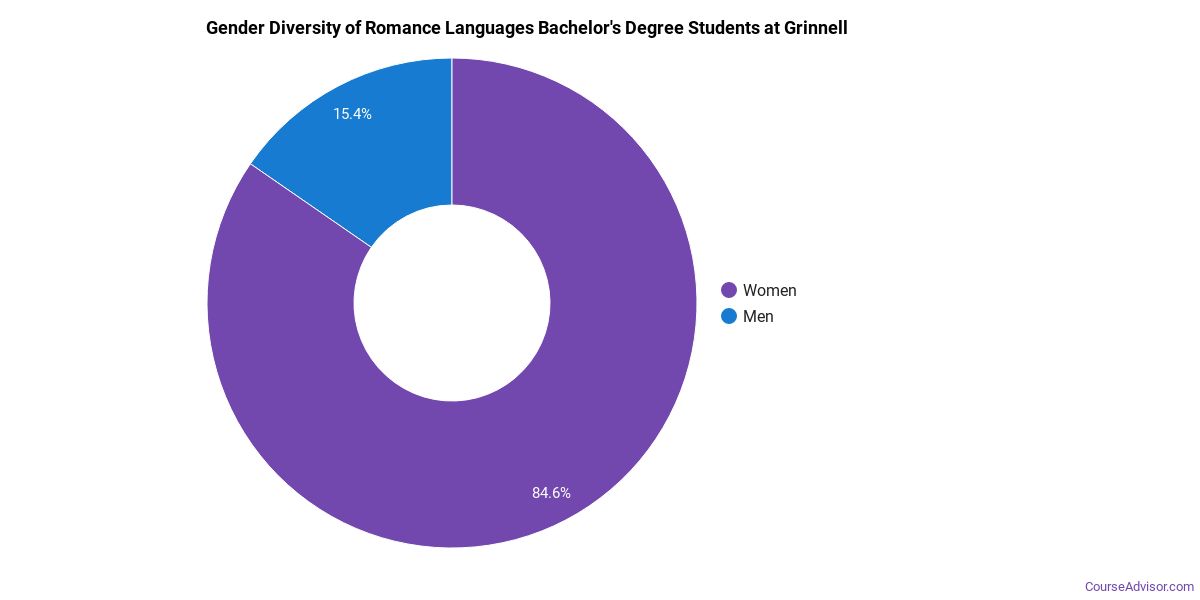
Across all degree levels, Romance Languages graduates at Grinnell College are 64% women (16) and 36% men (9).
Romance Languages Bachelor’s Program at Grinnell College
Among the 25 bachelor’s romance languages degrees awarded at Grinnell College, 64% were women (16) and 36% were men (9).
The following table and chart show the race/ethnicity of Romance Languages bachelor’s degree recipients at Grinnell College.
| Race / Ethnicity | Number of Graduates |
|---|---|
| White | 15 |
| Hispanic / Latino | 6 |
| Black / African American | 1 |
| Two or More Races | 1 |
| Unknown | 2 |
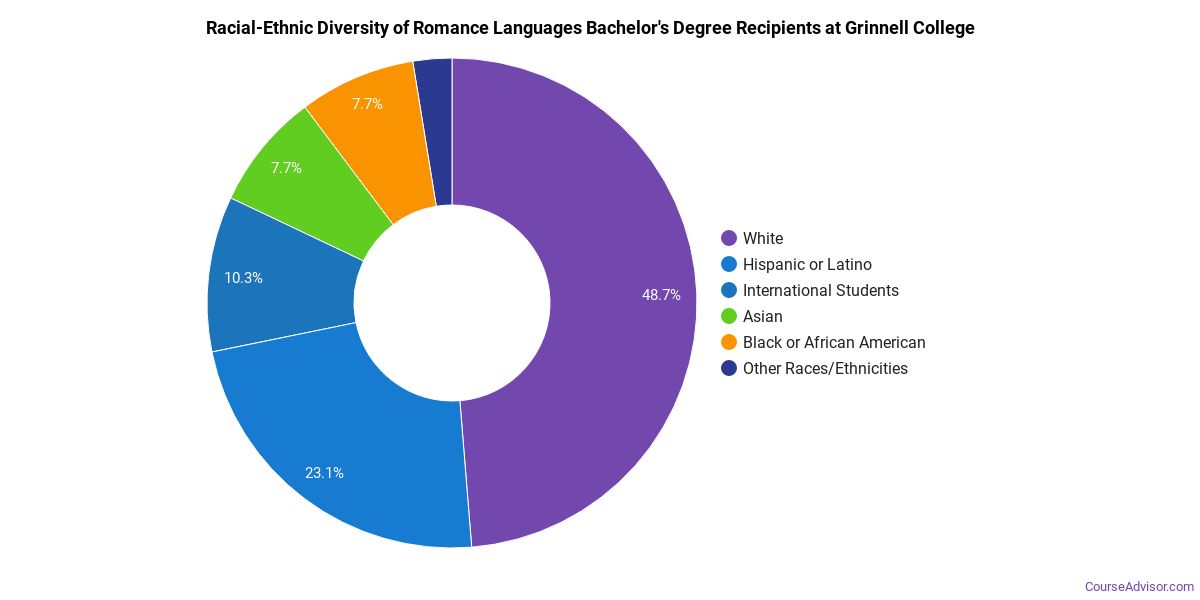
Minority students account for 32% of Romance Languages bachelor’s degree recipients at Grinnell College, lower than the national average of 45%.*
*The racial-ethnic minorities figure is the total number of graduates minus White, international (nonresident), and unknown-race graduates.
More Specific Romance Languages Concentrations at Grinnell College
The Romance Languages program at Grinnell College offers more specialized concentrations:
| Concentration | Graduates |
|---|---|
| French Language & Literature | 9 |
| Spanish Language & Literature | 16 |
Best-Paid Careers for Romance Languages Graduates
Those who complete Romance Languages program at Grinnell College pursue many career paths. The table below ranks the best-paid careers for Romance Languages graduates, ordered by median annual salary:
| Occupation | Nationwide Median Wage |
|---|---|
| Secondary School Teachers, Except Special and Career/Technical Education | $77,927 |
| Interpreters and Translators | $52,627 |
| Foreign Language and Literature Teachers, Postsecondary | $39,815 |
References
- IPEDS — Integrated Postsecondary Education Data System
- U.S. Department of Education — College Scorecard
- O*NET Online (Bureau of Labor Statistics)
- National Center for Education Statistics
More about our data sources and methodologies.
Course Advisor provides higher-education, college and university, degree, program, career, salary, and other helpful information to students, faculty, institutions, and other internet audiences. Presented information and data are subject to change. Inclusion on this website does not imply or represent a direct relationship with the company, school, or brand. Information, though believed correct at time of publication, may not be correct, and no warranty is provided. Contact the schools to verify any information before relying on it. Financial aid may be available for those who qualify. The displayed options may include sponsored or recommended results, not necessarily based on your preferences.
© Course Advisor – All Rights Reserved.