Greene County Vocational School District Overview
Located in Xenia, Ohio, Greene County Vocational School District is a public institution. Greene County Career Center is located in the countryside, which is perfect for students who enjoy a rural lifestyle.
What Is Greene County Vocational School District Known For?
- The highest award offered at Greene County Career Center is the undergraduate certificate.
- A student who earns a bachelor's degree from Greene County Career Center makes roughly $41,796 a year. This is 2% more than their peers from other colleges and universities.
Where Is Greene County Vocational School District?
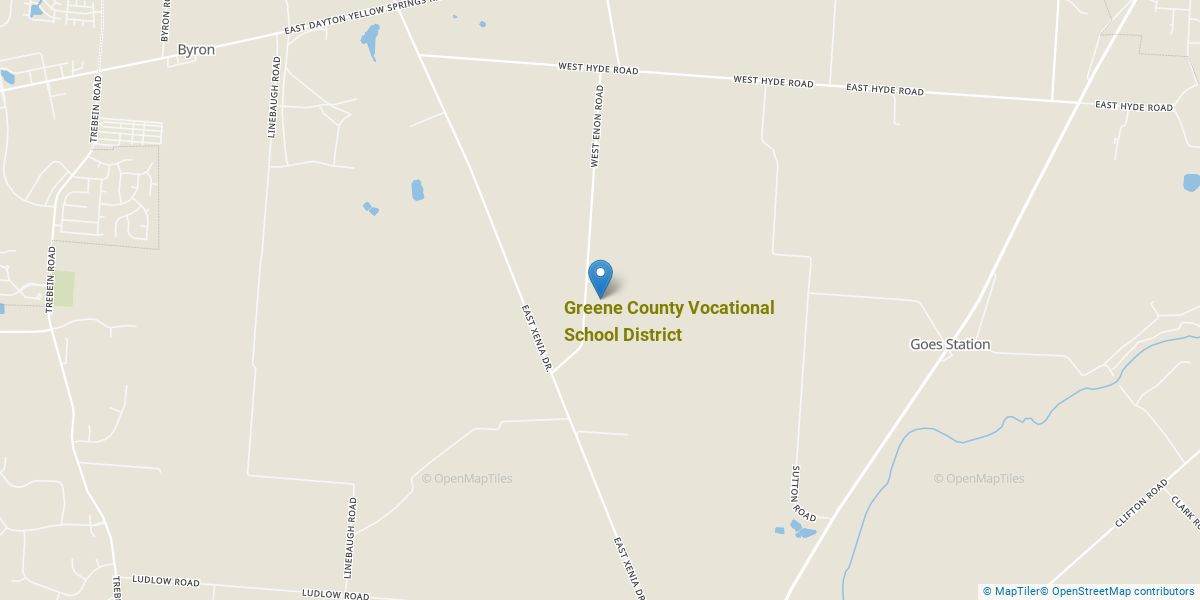
Contact details for Greene County Career Center are given below.
| Contact Details | |
|---|---|
| Address: | 532 Innovation Drive, Xenia, OH 45385-9545 |
| Phone: | 937-372-6941 |
| Website: | www.greeneccc.com |
Can I Afford Greene County Vocational School District?
Student Loan Debt
While almost two-thirds of students nationwide take out loans to pay for college, the percentage may be quite different for the school you plan on attending. At Greene County Career Center, approximately 33% of students took out student loans averaging $6,040 a year. That adds up to $24,160 over four years for those students.
The student loan default rate at Greene County Career Center is 7.1%. Although this is lower than the national default rate of 10.1%, you'll still want to keep this in mind when taking out student loans.
Explore Best Ranked Schools for You
Greene County Vocational School District Undergraduate Student Diversity
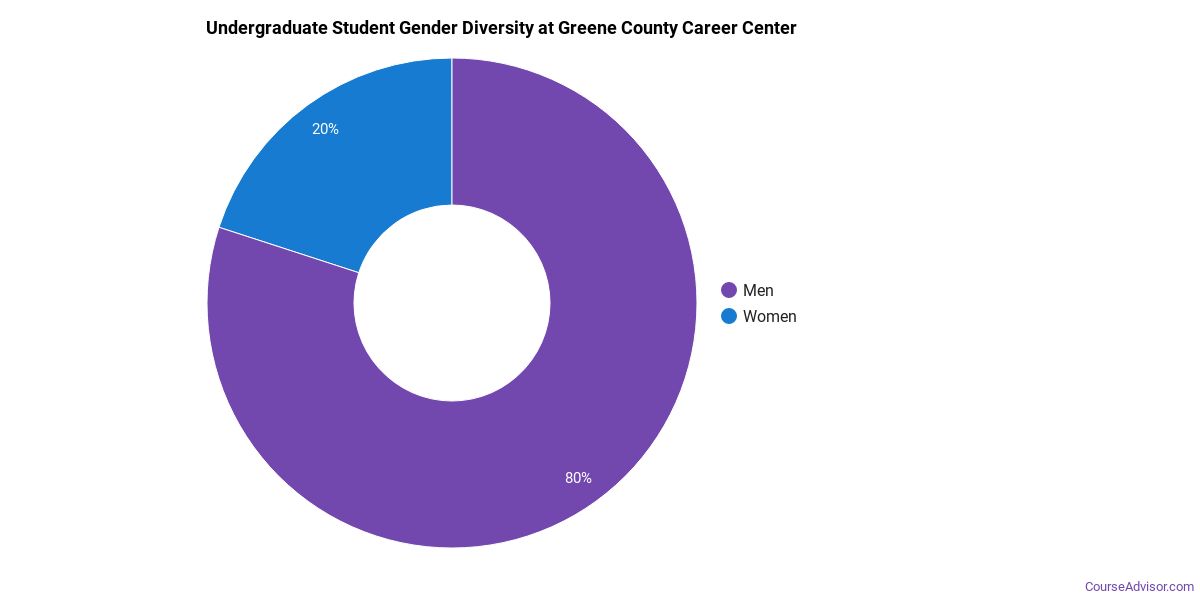
Gender Diversity
Of the 23 full-time undergraduates at Greene County Career Center, 83% are male and 17% are female.
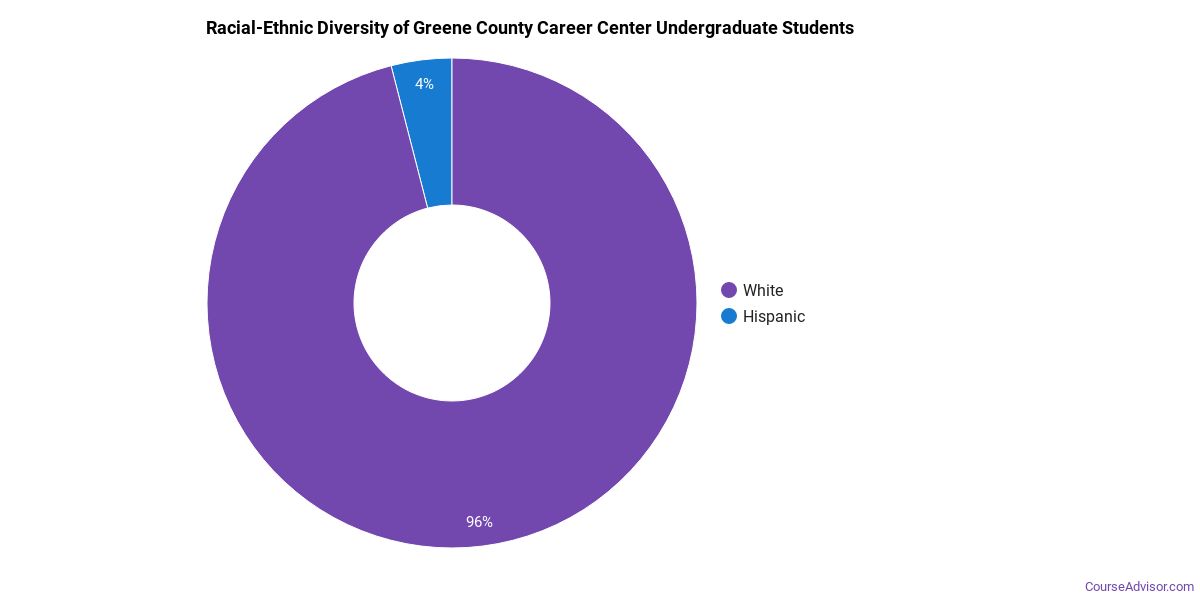
Racial-Ethnic Diversity
The racial-ethnic breakdown of Greene County Vocational School District students is as follows.
| Race/Ethnicity | Number of Grads |
|---|---|
| Asian | 0 |
| Black or African American | 2 |
| Hispanic or Latino | 0 |
| White | 21 |
| International Students | 0 |
| Other Races/Ethnicities | 0 |
Greene County Vocational School District Undergraduate Concentrations
The table below shows the number of awards for each concentration.
| Major | Basic Certificate | TOTAL |
|---|---|---|
| Criminal Justice & Corrections | 28 | 28 |
| TOTAL | 28 | 28 |
References
*The racial-ethnic minorities count is calculated by taking the total number of students and subtracting white students, international students, and students whose race/ethnicity was unknown. This number is then divided by the total number of students at the school to obtain the racial-ethnic minorities percentage.
More about our data sources and methodologies.
Course Advisor provides higher-education, college and university, degree, program, career, salary, and other helpful information to students, faculty, institutions, and other internet audiences. Presented information and data are subject to change. Inclusion on this website does not imply or represent a direct relationship with the company, school, or brand. Information, though believed correct at time of publication, may not be correct, and no warranty is provided. Contact the schools to verify any information before relying on it. Financial aid may be available for those who qualify. The displayed options may include sponsored or recommended results, not necessarily based on your preferences.
© Course Advisor – All Rights Reserved.