History at Duke University
What traits are you looking for in a school for History, consider the program at Duke University. We’ve gathered the following information to help you decide.
Duke University is in Durham, NC.
In the most recent year for which we have data, 24 history graduations were recorded at Duke University.
Featured schools near , edit
Studying Online at Duke University
Many students take online classes at Duke University. Of 17,499 students, 1,312 (7%) were enrolled entirely in distance education and 2,836 (16%) took at least some classes online.
History Rankings at Duke University
These rankings give you a sense of how Duke University’s History program against peer institutions.
Bachelor’s-Level Rankings
| Ranking | Scope | Rank |
|---|---|---|
| Best Schools (Quality) | North Carolina | #1 of 15 |
| Best Schools (Quality) | Southeast (Region) | #1 of 126 |
| Best Schools (Quality) | Nationwide | #4 of 618 |
| Best Value | North Carolina | #14 of 15 |
| Best Value | Southeast (Region) | #122 of 126 |
| Best Value | Nationwide | #569 of 615 |
Master’s-Level Rankings
| Ranking | Scope | Rank |
|---|---|---|
| Best Schools (Quality) | North Carolina | #1 of 15 |
| Best Schools (Quality) | Southeast (Region) | #1 of 126 |
| Best Schools (Quality) | Nationwide | #4 of 618 |
| Best Value | North Carolina | #14 of 15 |
| Best Value | Southeast (Region) | #122 of 126 |
| Best Value | Nationwide | #569 of 615 |
Doctoral-Level Rankings
| Ranking | Scope | Rank |
|---|---|---|
| Best Schools (Quality) | North Carolina | #1 of 15 |
| Best Schools (Quality) | Southeast (Region) | #1 of 126 |
| Best Schools (Quality) | Nationwide | #4 of 618 |
| Best Value | North Carolina | #14 of 15 |
| Best Value | Southeast (Region) | #122 of 126 |
| Best Value | Nationwide | #569 of 615 |
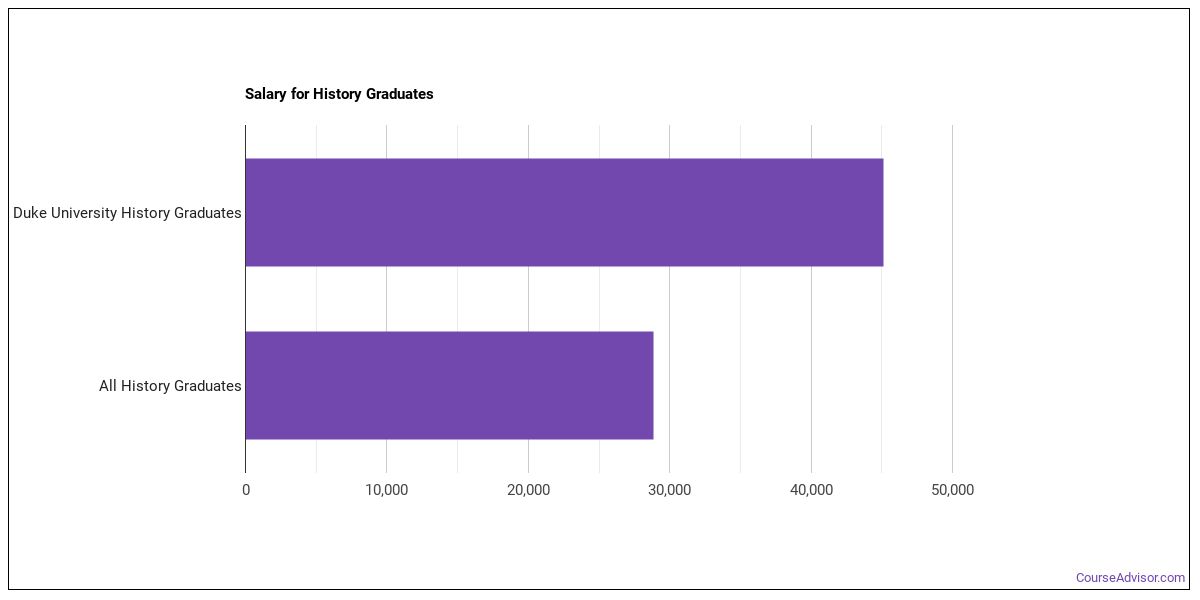
Earnings for History Graduates from Duke University
Graduates of Duke University’s History program report the following median earnings (per the U.S. Department of Education’s College Scorecard):
| Years After Graduation | Median Earnings |
|---|---|
| 1 year | $45,091 |
| 2 years | $52,941 |
| 4 years | $83,943 |
| 5 years | $85,818 |
How does this compare to the school overall? At the four-year mark, History graduates from Duke University report median earnings of $83,943, compared with $115,482 for all Duke University graduates — about 27% lower than the school-wide median.

Median Debt at Graduation
Median student loan debt for History graduates from Duke University is $13,000.
Student Demographics & Diversity
The following sections describe the diversity of History graduates at Duke University, broken down by degree level.
Program-wide, History graduates at Duke University are 71% women (17) and 29% men (7).
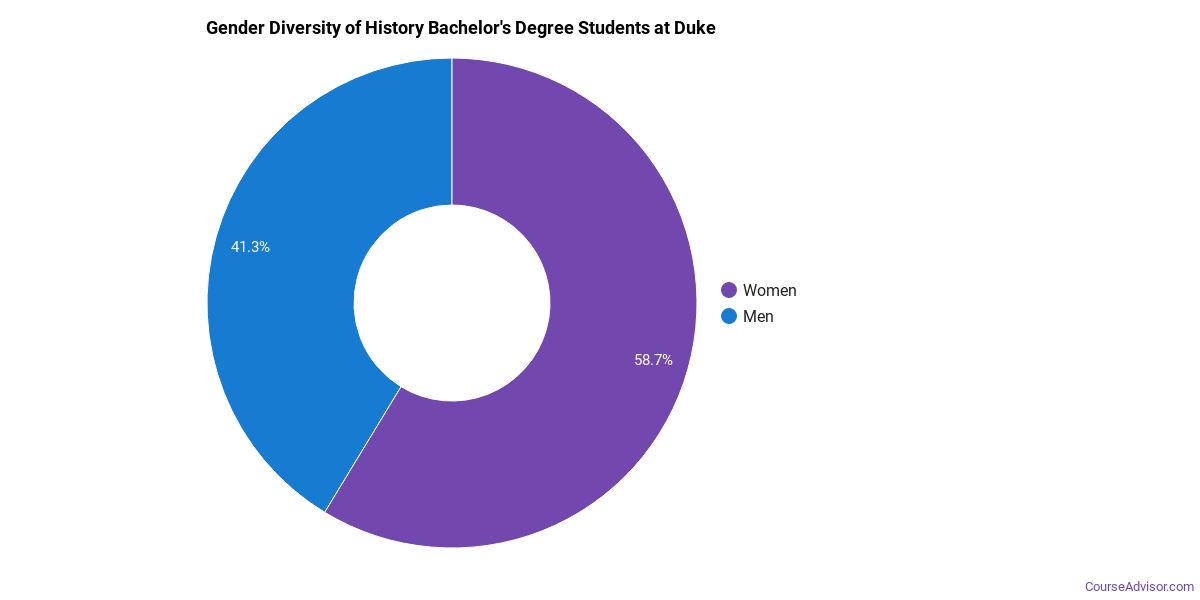
History Bachelor’s Program at Duke University
Of the 17 bachelor’s history graduates at Duke University, 71% were women (12) and 29% were men (5).
The following table and chart show the race/ethnicity of History bachelor’s degree recipients at Duke University.
| Race / Ethnicity | Number of Graduates |
|---|---|
| White | 8 |
| Hispanic / Latino | 1 |
| Asian | 3 |
| Two or More Races | 2 |
| International (Nonresident) | 1 |
| Unknown | 2 |
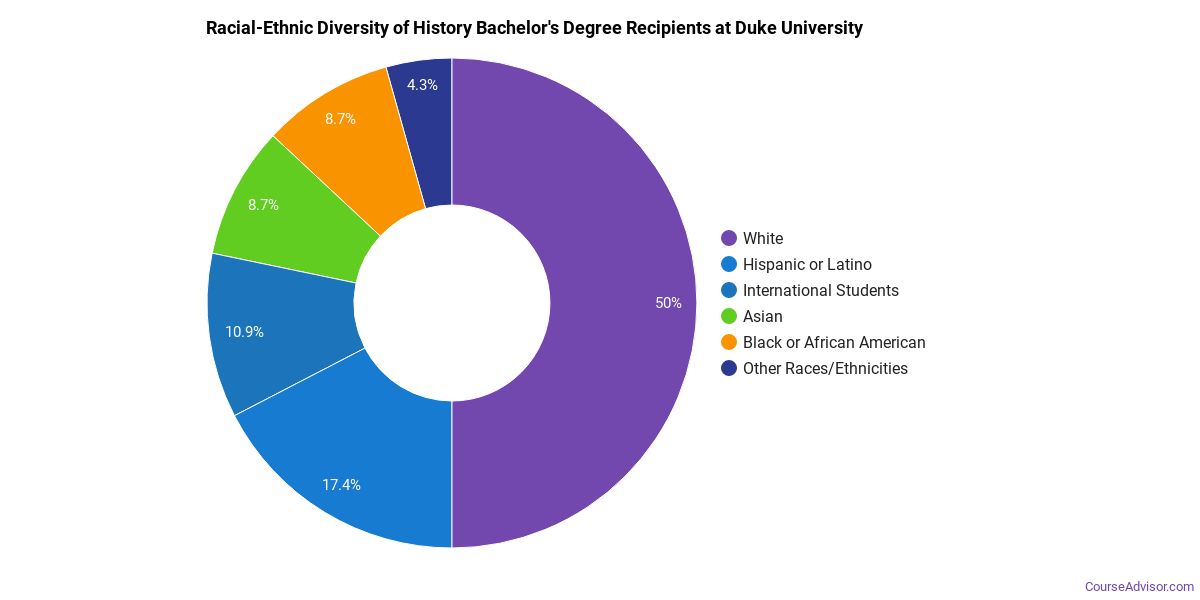
Minority students account for 35% of History bachelor’s degree recipients at Duke University, above the national average of 28%.*
History Doctoral Program at Duke University
Of the 7 doctoral history degrees awarded at Duke University, 71% were women (5) and 29% were men (2).

The following table and chart show the race/ethnicity of History doctoral degree recipients at Duke University.
| Race / Ethnicity | Number of Graduates |
|---|---|
| White | 3 |
| Black / African American | 1 |
| Asian | 1 |
| Two or More Races | 1 |
| International (Nonresident) | 1 |

Racial-ethnic minorities make up 43% of History doctoral degree recipients at Duke University, above the national average of 19%.*
*The racial-ethnic minorities figure is the total number of graduates minus White, international (nonresident), and unknown-race graduates.
More Specific History Concentrations at Duke University
The History program at Duke University includes the following sub-specializations:
| Concentration | Graduates |
|---|---|
| General History | 23 |
| Other History | 1 |
Top-Paying Careers for History Graduates
Those who complete History program at Duke University work across a variety of fields. Below are the top-paying careers for History majors, ordered by median annual salary:
| Occupation | Nationwide Median Wage |
|---|---|
| Water Resource Specialists | $179,716 |
| Wind Energy Development Managers | $169,952 |
| Loss Prevention Managers | $165,723 |
| Natural Sciences Managers | $132,227 |
| Wind Energy Operations Managers | $122,567 |
| Compliance Managers | $117,178 |
| Clinical Research Coordinators | $110,931 |
| Brownfield Redevelopment Specialists and Site Managers | $99,321 |
| Museum Technicians and Conservators | $96,273 |
| Managers, All Other | $95,684 |
References
- IPEDS — Integrated Postsecondary Education Data System
- U.S. Department of Education — College Scorecard
- O*NET Online (Bureau of Labor Statistics)
- National Center for Education Statistics
More about our data sources and methodologies.
Course Advisor provides higher-education, college and university, degree, program, career, salary, and other helpful information to students, faculty, institutions, and other internet audiences. Presented information and data are subject to change. Inclusion on this website does not imply or represent a direct relationship with the company, school, or brand. Information, though believed correct at time of publication, may not be correct, and no warranty is provided. Contact the schools to verify any information before relying on it. Financial aid may be available for those who qualify. The displayed options may include sponsored or recommended results, not necessarily based on your preferences.
© Course Advisor – All Rights Reserved.