Dean College Overview
Dean College is a private not-for-profit institution located in Franklin, Massachusetts. Franklin is a good match for students who enjoy the safety and convenience of the suburbs.
What Is Dean College Known For?
- The bachelor's degree is the highest award offered at Dean College.
- In a recent academic period26% of the faculty were full-time.
- The average Dean College student graduates in 4.1 years. That's better than the national average of 4.4 years.
Where Is Dean College?
Contact details for Dean College are given below.
| Contact Details | |
|---|---|
| Address: | 99 Main Street, Franklin, MA 02038-1941 |
| Phone: | 508-541-1900 |
| Website: | www.dean.edu |
How Do I Get Into Dean College?
You can apply to Dean College online at: www.dean.edu/apply
Admission Requirements for Dean College
| Submission | Required? |
|---|---|
| High School GPA | 1 |
| High School Rank | 3 |
| High School Transcript | 1 |
| College Prep Program | 1 |
| Recommendations | 5 |
| SAT or ACT Scores | 3 |
| TOEFL | 1 |
How Hard Is It To Get Into Dean College?
Approximately 43% of accepted students are men and 55% are women. The acceptance rate for men is 74%, and the acceptance rate for women is 78%.
Can I Afford Dean College?
The net price is calculated by adding tuition, room, board and other costs and subtracting financial aid.
Student Loan Debt
Almost 66% of college students who graduated with the class of 2018 took out student loans, but that percentage varies from school to school. At Dean College, approximately 76% of students took out student loans averaging $12,126 a year. That adds up to $48,504 over four years for those students.
Explore Best Ranked Schools for You
Dean College Undergraduate Student Diversity
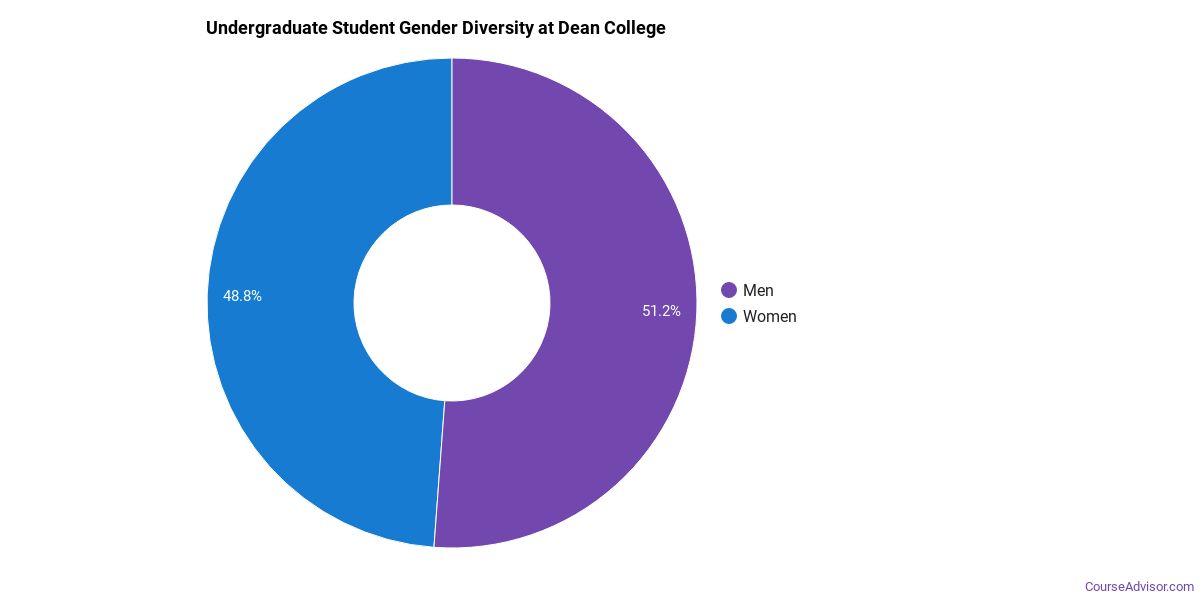
Gender Diversity
Of the 1,035 full-time undergraduates at Dean College, 49% are male and 51% are female.
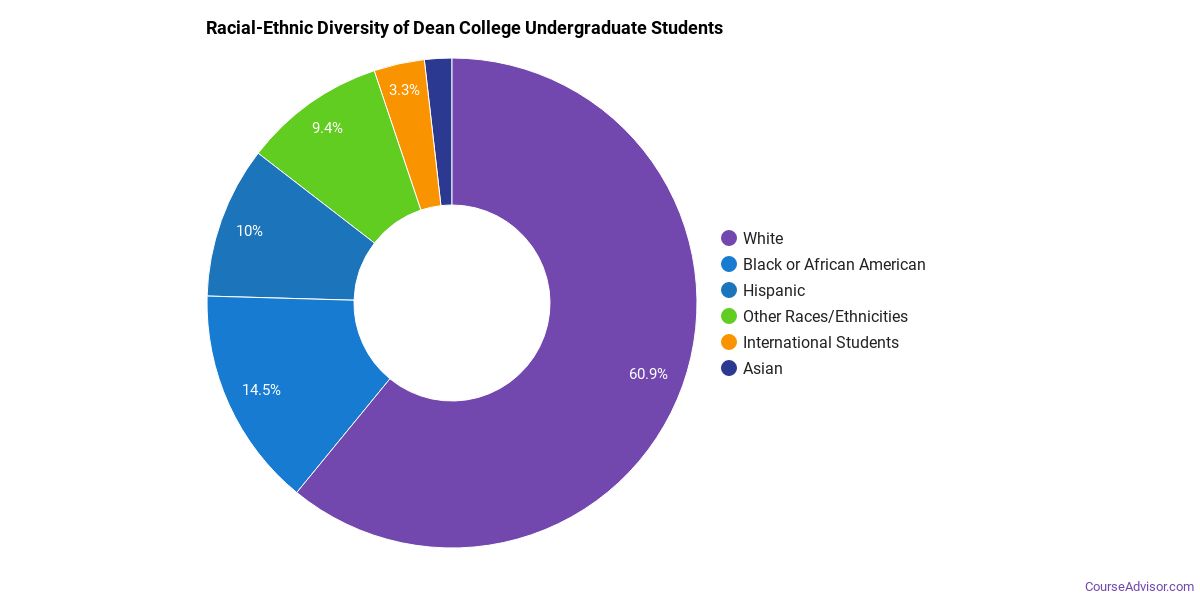
Racial-Ethnic Diversity
The racial-ethnic breakdown of Dean College students is as follows.
| Race/Ethnicity | Number of Grads |
|---|---|
| Asian | 15 |
| Black or African American | 127 |
| Hispanic or Latino | 93 |
| White | 660 |
| International Students | 48 |
| Other Races/Ethnicities | 92 |
Geographic Diversity
Massachusetts students aren't the only ones who study at Dean College. At this time, 26 states are represented by the student population at the school.
Over 15 countries are represented at Dean College. The most popular countries sending students to the school are Hong Kong, China, and Japan.
Dean College Undergraduate Concentrations
The table below shows the number of awards for each concentration.
| Major | Basic Certificate | Associate’s | Bachelor’s | TOTAL |
|---|---|---|---|---|
| Health & Physical Education | 0 | 8 | 56 | 64 |
| Business Administration & Management | 0 | 19 | 28 | 47 |
| Dance | 0 | 5 | 34 | 39 |
| Drama & Theater Arts | 0 | 1 | 31 | 32 |
| Criminal Justice & Corrections | 0 | 3 | 23 | 26 |
| Communication & Media Studies | 0 | 2 | 16 | 18 |
| Teacher Education Grade Specific | 1 | 4 | 8 | 13 |
| General Psychology | 0 | 3 | 8 | 11 |
| Journalism | 0 | 0 | 8 | 8 |
| Liberal Arts General Studies | 0 | 4 | 3 | 7 |
| Sociology | 0 | 5 | 1 | 6 |
| Arts & Media Management | 0 | 0 | 6 | 6 |
| General Biology | 0 | 3 | 2 | 5 |
| History | 0 | 1 | 4 | 5 |
| General English Literature | 0 | 0 | 4 | 4 |
| Health/Medical Prep Programs | 0 | 4 | 0 | 4 |
| Accounting | 1 | 1 | 0 | 2 |
| Marketing | 0 | 0 | 2 | 2 |
| Human Resource Management | 1 | 0 | 0 | 1 |
| Health Sciences & Services | 0 | 1 | 0 | 1 |
| Homeland Security | 1 | 0 | 0 | 1 |
| TOTAL | 4 | 64 | 234 | 302 |
References
*The racial-ethnic minorities count is calculated by taking the total number of students and subtracting white students, international students, and students whose race/ethnicity was unknown. This number is then divided by the total number of students at the school to obtain the racial-ethnic minorities percentage.
More about our data sources and methodologies.
Course Advisor provides higher-education, college and university, degree, program, career, salary, and other helpful information to students, faculty, institutions, and other internet audiences. Presented information and data are subject to change. Inclusion on this website does not imply or represent a direct relationship with the company, school, or brand. Information, though believed correct at time of publication, may not be correct, and no warranty is provided. Contact the schools to verify any information before relying on it. Financial aid may be available for those who qualify. The displayed options may include sponsored or recommended results, not necessarily based on your preferences.
© Course Advisor – All Rights Reserved.